Introduction
When operating Java applications, you may sometimes face issues such as sudden performance degradation or slow response times. To identify the root cause of such problems, it is effective to capture and analyze various dumps that record the internal state of the application—namely thread dumps, heap dumps, and core dumps.
In this article, we explain the role of each type of dump, how to capture them, and how to use them in performance troubleshooting, with concrete examples.
Comparison of Different Dump Types
Each type of dump has its own purpose and characteristics.
When performing an investigation, it is generally best to start by collecting information that places the least load on the server at the time of capture.
- Use thread dumps when you want to quickly and lightweightly inspect the runtime state.
- Use heap dumps when you suspect memory usage issues or memory leaks.
- If the root cause cannot be identified with these, or if a serious JVM or native-level issue is suspected, use core dumps as a last resort.
Choose the appropriate dump depending on the situation. Details are described below.
| Item | Thread Dump | Heap Dump | Core Dump |
|---|---|---|---|
| Purpose | Investigate thread states and deadlocks | Analyze Java heap contents | Analyze entire process memory (crash analysis) |
| Contents | Thread states, stack traces, locks | Objects, classes, heap usage | Entire process memory, registers, stacks |
| Timing | Anytime | Anytime | On abnormal termination or manual |
| Use cases | Hangs, deadlocks, thread contention | Memory leaks, OutOfMemoryError | OS-level crashes, JVM bugs |
| Size | Small (KB–MB) | Large (hundreds of MB–GB) | Very large (GB-scale) |
| Impact | Low | High (possible GC pauses or app slowdown) | Very high (process interruption) |
| Capture method | kill -3, jstack, jcmd | jmap, jcmd | OS-generated core file, gcore |
| Analysis tools | JDK tools (JConsole), VisualVM | Eclipse MAT, VisualVM | gdb, lldb, jhsdb |
| App continuity | Continues running | Generally continues (temporary slowdown possible) | Stops (treated as a crash) |
Thread Dump: Capture and Analysis
A thread dump is a snapshot of all threads running inside the Java Virtual Machine (JVM). It provides the following information:
- Thread states (RUNNABLE, BLOCKED, WAITING, TIMED_WAITING, etc.)
- Locks held or awaited by each thread
- Stack traces (which methods threads are executing or blocked on)
- Presence of deadlocks
By analyzing this information, you can identify performance bottlenecks, deadlocks, and even hints of memory leaks.
Capturing a Thread Dump
Using the kill Command
By adding the -3 option to the kill command, you can capture a thread dump. Because this is a standard OS command, it works in almost any environment—even when threads appear frozen.
The performance impact is minimal, making this the recommended approach for production systems.Example using a Tomcat process:
[root@quiz ~]# kill -3 274968
[root@quiz ~]# tail -1000 /opt/tomcat/logs/catalina.out
~~Truncated~~
2025-12-02 06:29:22
Full thread dump OpenJDK 64-Bit Server VM (21.0.2+13-58 mixed mode, sharing):
Threads class SMR info:
_java_thread_list=0x00007f366c002460, length=31, elements={
0x00007f371c02ce30, 0x00007f371c0ecff0, 0x00007f371c0ee650, 0x00007f371c0f0140,
0x00007f371c0f1790, 0x00007f371c0f2d40, 0x00007f371c0f4890, 0x00007f371c0f5f60,
0x00007f371c11f7b0, 0x00007f371c17e380, 0x00007f371c1f9610, 0x00007f371c2c3210,
0x00007f371c2cda70, 0x00007f371c2d5d30, 0x00007f371c568c80, 0x00007f371db6a490,
0x00007f371db63890, 0x00007f371e9bfce0, 0x00007f3648001200, 0x00007f371c9da6a0,
0x00007f371c9dba80, 0x00007f371c9dcd20, 0x00007f371c9de3b0, 0x00007f371ca00e60,
0x00007f371ca02000, 0x00007f371ca036b0, 0x00007f371ca04d60, 0x00007f371ca06330,
0x00007f371ca07900, 0x00007f371c9f9b70, 0x00007f371c9850b0
}
"main" #1 [274969] prio=5 os_prio=0 cpu=12421.73ms elapsed=108.91s tid=0x00007f371c02ce30 nid=274969 runnable  [0x00007f3723710000]
   java.lang.Thread.State: RUNNABLE
        at sun.nio.ch.Net.accept(java.base@21.0.2/Native Method)
        at sun.nio.ch.NioSocketImpl.accept(java.base@21.0.2/NioSocketImpl.java:748)
        at java.net.ServerSocket.implAccept(java.base@21.0.2/ServerSocket.java:698)
        at java.net.ServerSocket.platformImplAccept(java.base@21.0.2/ServerSocket.java:663)
        at java.net.ServerSocket.implAccept(java.base@21.0.2/ServerSocket.java:639)
        at java.net.ServerSocket.implAccept(java.base@21.0.2/ServerSocket.java:585)
        at java.net.ServerSocket.accept(java.base@21.0.2/ServerSocket.java:543)
        at org.apache.catalina.core.StandardServer.await(StandardServer.java:557)
        at org.apache.catalina.startup.Catalina.await(Catalina.java:851)
        at org.apache.catalina.startup.Catalina.start(Catalina.java:799)
~~Truncated~~
"G1 Conc#0" os_prio=0 cpu=203.73ms elapsed=108.91s tid=0x00007f371c06e090 nid=274972 runnable
"G1 Refine#0" os_prio=0 cpu=136.13ms elapsed=108.90s tid=0x00007f371c0b08e0 nid=274973 runnable
"G1 Service" os_prio=0 cpu=7.07ms elapsed=108.90s tid=0x00007f371c0b18a0 nid=274974 runnable
"VM Periodic Task Thread" os_prio=0 cpu=96.28ms elapsed=108.88s tid=0x00007f371c0c2930 nid=274975 waiting on condition
JNI global refs: 21, weak refs: 0
Heap
 garbage-first heap   total 98304K, used 76135K [0x00000000c6e00000, 0x0000000100000000)
  region size 1024K, 45 young (46080K), 7 survivors (7168K)
 Metaspace       used 73266K, committed 74048K, reserved 1114112K
  class space    used 9706K, committed 10048K, reserved 1048576K
Capturing with jstack
If the JDK is installed, you can obtain a thread dump using the jstack tool included with the JDK. By executing the command shown below, you can output a thread dump including lock information to a file.
[root@quiz ~]# jstack -l 1022886 > /tmp/threaddump_$(date +%Y%m%d_%H%M%S).txt
[root@quiz ~]#
Here, 1022886 specifies the PID of the target process from which the thread dump is collected. Be sure to check the PID in advance using commands such as ps before running this command.
By adding the -l option, you can also capture information about the locks held by each thread. In addition, rather than taking the thread dump only once, collecting multiple thread dumps at intervals and comparing them allows you to analyze thread usage patterns and identify potential bottlenecks.
How to Capture a Thread Dump Using jconsole / VisualVM
If JMX (Java Management Extensions) is enabled, you can capture a thread dump through the GUI using jconsole or VisualVM.
Precautions When Capturing a Thread Dump
Compared to heap dumps or core dumps, capturing a thread dump is relatively safe. However, when performing this operation on a production system, there are several important points to keep in mind. Please determine the appropriate timing after understanding the following considerations.
- The application may pause momentarily
While capturing a thread dump does not stop the entire JVM, a temporary Stop-The-World (STW) event may occur, causing application threads to pause briefly. In addition, CPU and I/O usage may temporarily increase during the capture process. As a result, system throughput may decrease or response latency may increase. For these reasons, it is recommended to capture thread dumps during periods of low system load. - Multiple thread dumps are required
Because thread states change瞬時に over time, a single thread dump is often insufficient to identify issues. It is recommended to capture five or more thread dumps at intervals of a few seconds and compare them to identify thread usage patterns and potential problems. - Be mindful of the output file size
If the JVM or application has a large number of threads, the thread dump file can become quite large. It is recommended to output the dump to a dedicated log directory with sufficient free disk space and minimal impact on production services.
How to Analyze a Thread Dump
As an example, let’s analyze a thread dump captured using the jstack command.
Below is a very clear example in which a deadlock has been detected. You can see that Thread-0 and Thread-1 are each holding locks required by the other, resulting in a deadlock situation.
2025-12-02 06:42:26
Full thread dump OpenJDK 64-Bit Server VM (21.0.2+13-58 mixed mode, sharing):
~~Truncated~~
Found one Java-level deadlock:
=============================
"Thread-0":
  waiting to lock monitor 0x00007fa568002d90 (object 0x00000000ca711b58, a java.lang.Object),
  which is held by "Thread-1"
"Thread-1":
  waiting to lock monitor 0x00007fa55c001160 (object 0x00000000ca711b48, a java.lang.Object),
  which is held by "Thread-0"
Java stack information for the threads listed above:
===================================================
"Thread-0":
        at DeadlockSample.lambda$main$0(DeadlockSample.java:16)
        - waiting to lock <0x00000000ca711b58> (a java.lang.Object)
        - locked <0x00000000ca711b48> (a java.lang.Object)
        at DeadlockSample$$Lambda/0x00007fa598000a00.run(Unknown Source)
        at java.lang.Thread.runWith(java.base@21.0.2/Thread.java:1596)
        at java.lang.Thread.run(java.base@21.0.2/Thread.java:1583)
"Thread-1":
        at DeadlockSample.lambda$main$1(DeadlockSample.java:29)
        - waiting to lock <0x00000000ca711b48> (a java.lang.Object)
        - locked <0x00000000ca711b58> (a java.lang.Object)
        at DeadlockSample$$Lambda/0x00007fa598000c18.run(Unknown Source)
        at java.lang.Thread.runWith(java.base@21.0.2/Thread.java:1596)
        at java.lang.Thread.run(java.base@21.0.2/Thread.java:1583)
Found 1 deadlock.
How to Capture and Analyze a Heap Dump
A heap dump is a snapshot of the memory contents in the JVM heap, output as a file. It can be analyzed to identify the causes of memory leaks and to determine whether objects are being retained in memory longer than necessary.
How to Capture a Heap Dump
Capturing a Heap Dump Using the jcmd Command
When capturing a heap dump from a running production environment, you can safely obtain the required information by using the jcmd command. By executing the command as shown below, you can generate a heap dump file in HPROF format.
[root@quiz ~]# jcmd 311127 GC.heap_dump /tmp/heapdump_$(date +%Y%m%d_%H%M%S).hprof
311127:
Dumping heap to /tmp/heapdump_20251203_161828.hprof ...
Heap dump file created [67250434 bytes in 0.793 secs]
[root@quiz ~]#
Automatically Capturing a Heap Dump on OOM
When a Java application terminates due to an OutOfMemoryError (OOM), you can configure it to automatically generate a heap dump. Below is an example configuration for Apache Tomcat.
Add the following options to setenv.sh:
-XX:+HeapDumpOnOutOfMemoryError -XX:HeapDumpPath=$CATALINA_BASE/logs/heapdump_$(date +%Y%m%d_%H%M%S).hprof”
[root@quiz ~]# cat /opt/tomcat/bin/setenv.sh
export JAVA_HOME=/opt/java/jdk-21.0.2
export JRE_HOME=$JAVA_HOME
export PATH=$JAVA_HOME/bin:$PATH
# heap dump setting
CATALINA_OPTS="$CATALINA_OPTS \
-XX:+HeapDumpOnOutOfMemoryError -XX:HeapDumpPath=/tmp/heapdump_$(date +%Y%m%d_%H%M%S).hprof"
[root@quiz ~]#
[root@quiz ~]# systemctl restart tomcat
[root@quiz ~]#
Capturing a Heap Dump Using the jmap Command
By using the jmap (Java Memory Map) command, you can inspect the memory usage of a running Java process and capture a heap dump. However, there have been reports that executing this command can cause the JVM to hang or crash depending on the environment. For this reason, it is recommended to avoid using jmap and use the jcmd command instead whenever possible.
As shown below, you can capture a heap dump (HPROF file) using the jmap command:
[root@quiz ~]# jmap -dump:format=b,file=/tmp/heapdump_$(date +%Y%m%d_%H%M%S).hprof 996008
Dumping heap to /tmp/heapdump_20251112_063454.hprof ...
Heap dump file created [126793933 bytes in 1.171 secs]
[root@quiz ~]#
Meaning of the Command Options
- -dump
Specifies that the entire heap should be dumped. - format=b
Outputs the heap dump in binary format. - file=
Specifies the output file name and path. Be sure to select a directory where you have write permissions. - 996008
Specifies the PID of the target process to analyze. You can check the PID using commands such as ps.
Precautions When Taking a Heap Dump
Obtaining a heap dump is an effective method for gaining a detailed understanding of the JVM’s memory state. However, executing it on a production system carries significant risks. For the reasons described below, taking a heap dump during normal production operation is generally not recommended. If it is absolutely necessary, it should be performed during a planned service downtime, at a point where temporary suspension is acceptable, or during a low-traffic period.
- The application may stop (Stop-The-World)
When a heap dump is taken, the JVM scans the entire heap, which causes a Stop-The-World (STW) pause in many JVM implementations. If the heap size is large (for example, 8 GB or more), the number of objects is high, or a memory leak is occurring, the pause can last from several seconds to tens of seconds or longer. In addition, depending on the dump method, the JVM may be forcibly terminated. Be sure to understand the characteristics and risks of the command you plan to use in advance. - It may trigger performance degradation or timeouts
During heap dump generation, performance can be impacted due to increased thread blocking, I/O delays, and latency in external API or database access. - The resulting file size can be extremely large
Because a heap dump writes out the entire JVM heap, the file size can reach several gigabytes or even tens of gigabytes. If the file is too large, it can lead to issues such as application outages due to disk exhaustion, increased I/O load causing response delays, or slower write speeds that further extend the Stop-The-World pause. It is recommended to output heap dumps to a dedicated log area with sufficient free space and no impact on service availability.
How to Analyze a Heap Dump
Eclipse Memory Analyzer (MAT) is commonly used to analyze heap dumps. On your client machine, download the tool from the Eclipse website shown below, extract the ZIP file, and launch it by executing MemoryAnalyzer.exe.
Downloads | The Eclipse Foundation
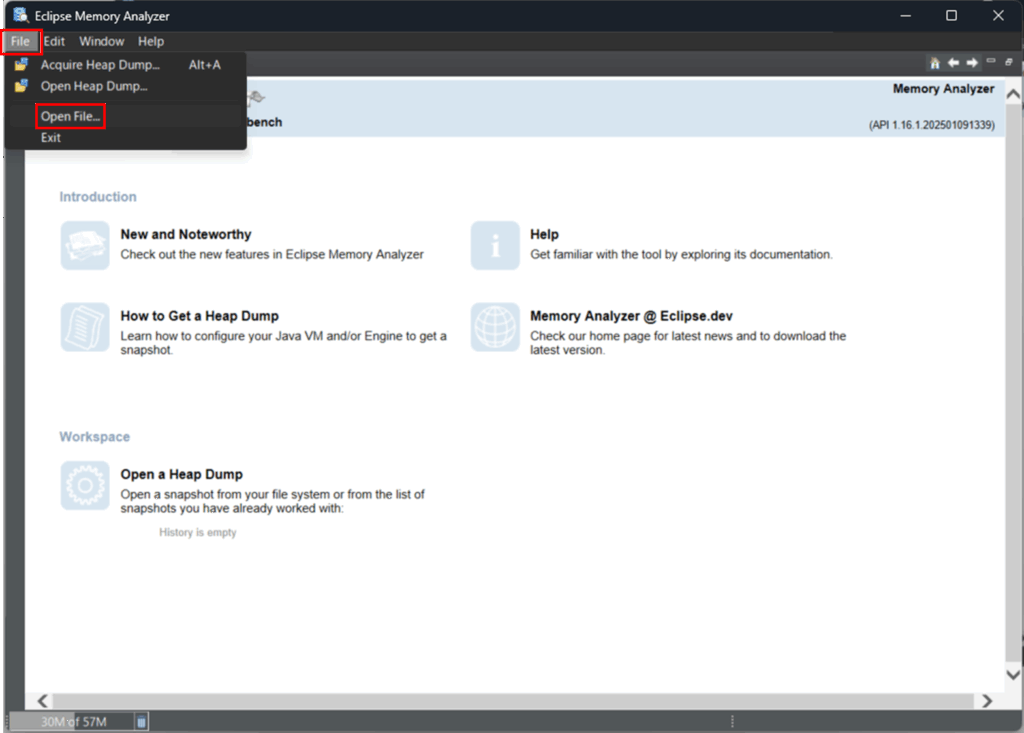
After launching, a GUI screen like the one below will be displayed.

Click File > Open File…, then select the generated dump file (.hprof).
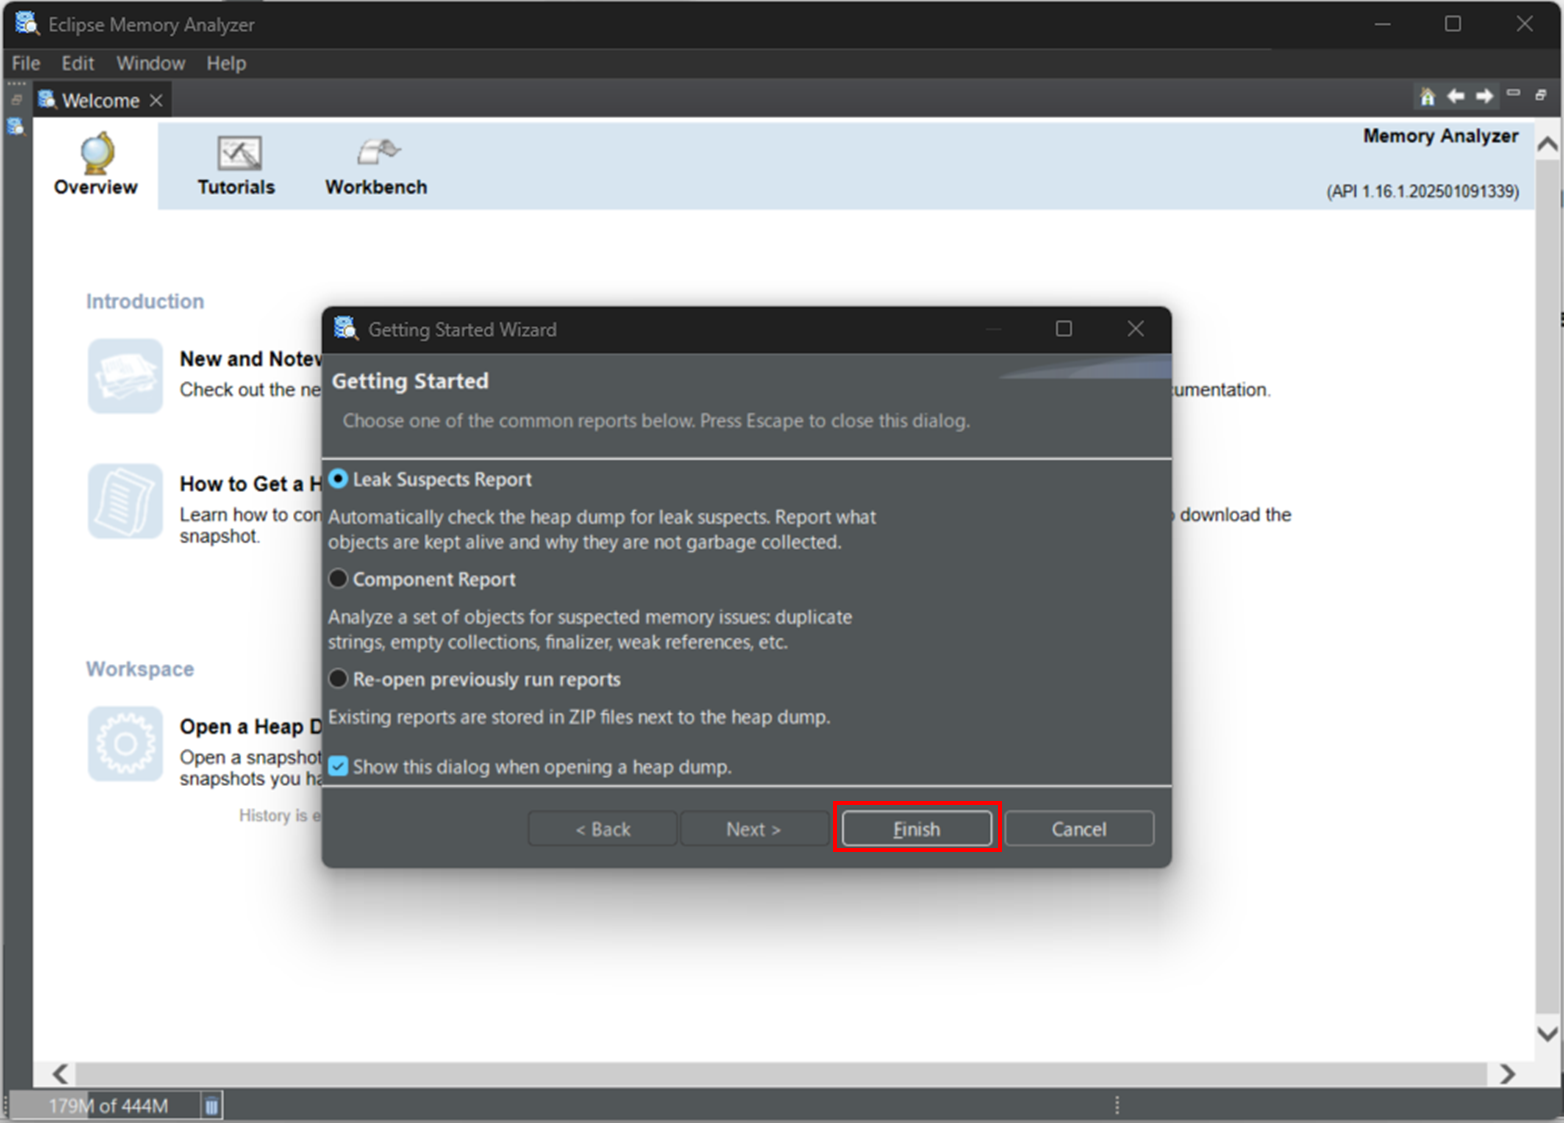
Choose Leak Suspects Report and click Finish.
MAT provides a wide range of features, but the following workflow is recommended for identifying the root cause of memory leaks:
- Suspects Report (Get an overview and identify suspicious areas)
- Histogram (Identify classes that are consuming large amounts of memory)
- Dominator Tree (Determine what is retaining the objects and identify the cause)
- Path to GC Roots (Confirm the reference chain and pinpoint the root cause)
Each of these steps is explained below.
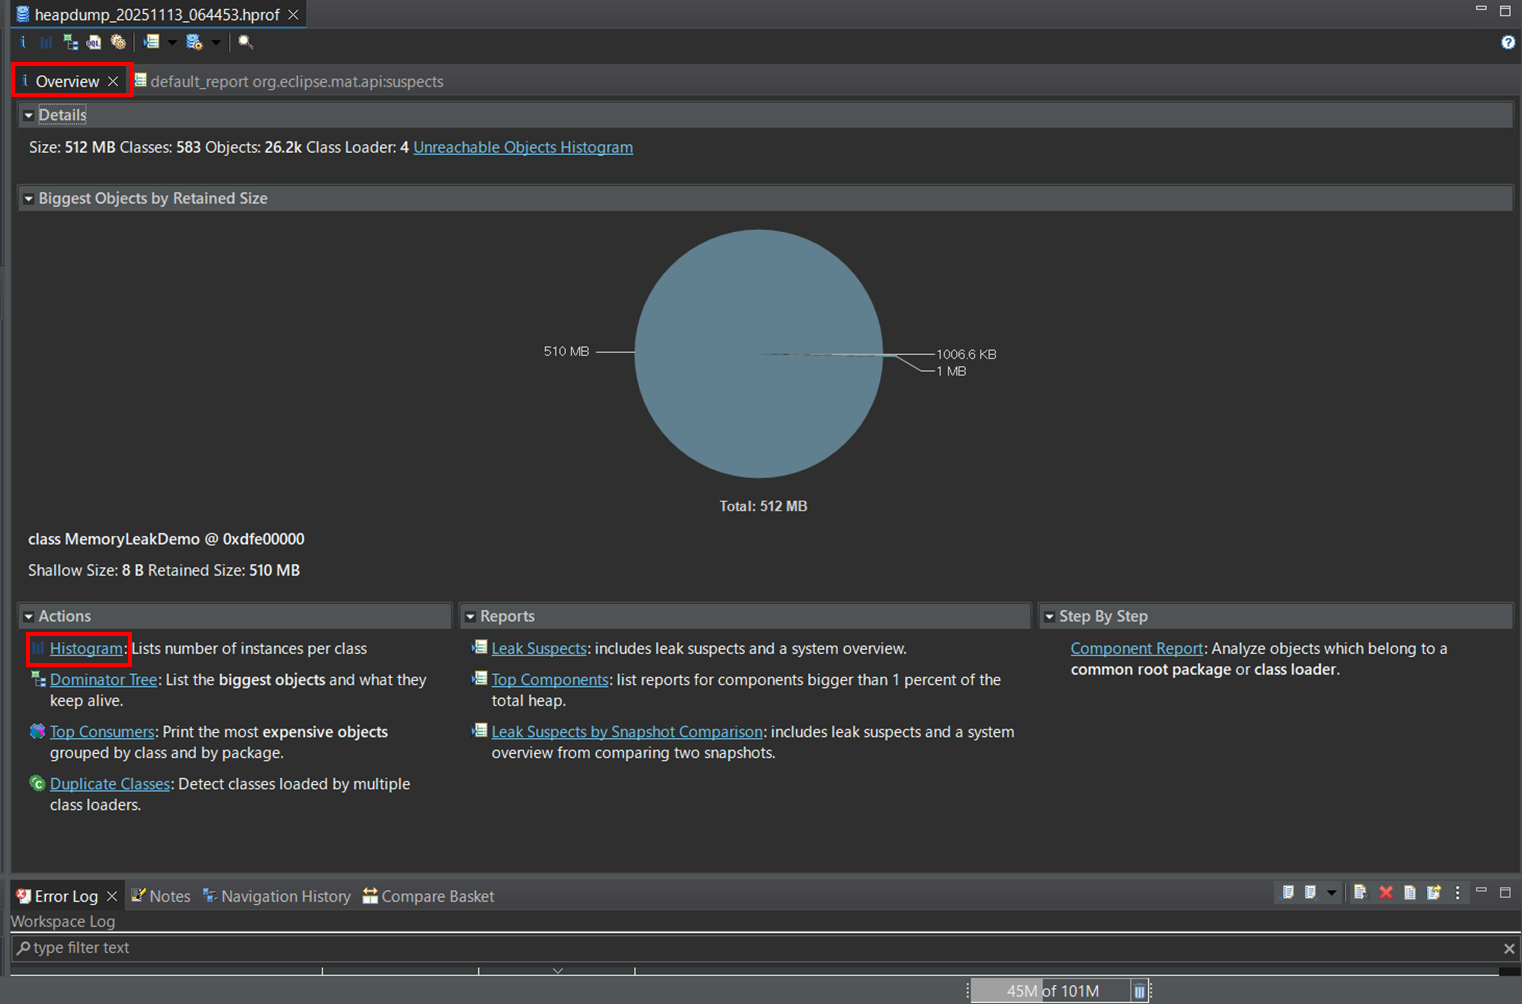
Suspects Report (Overview and Identification of Suspicious Areas)
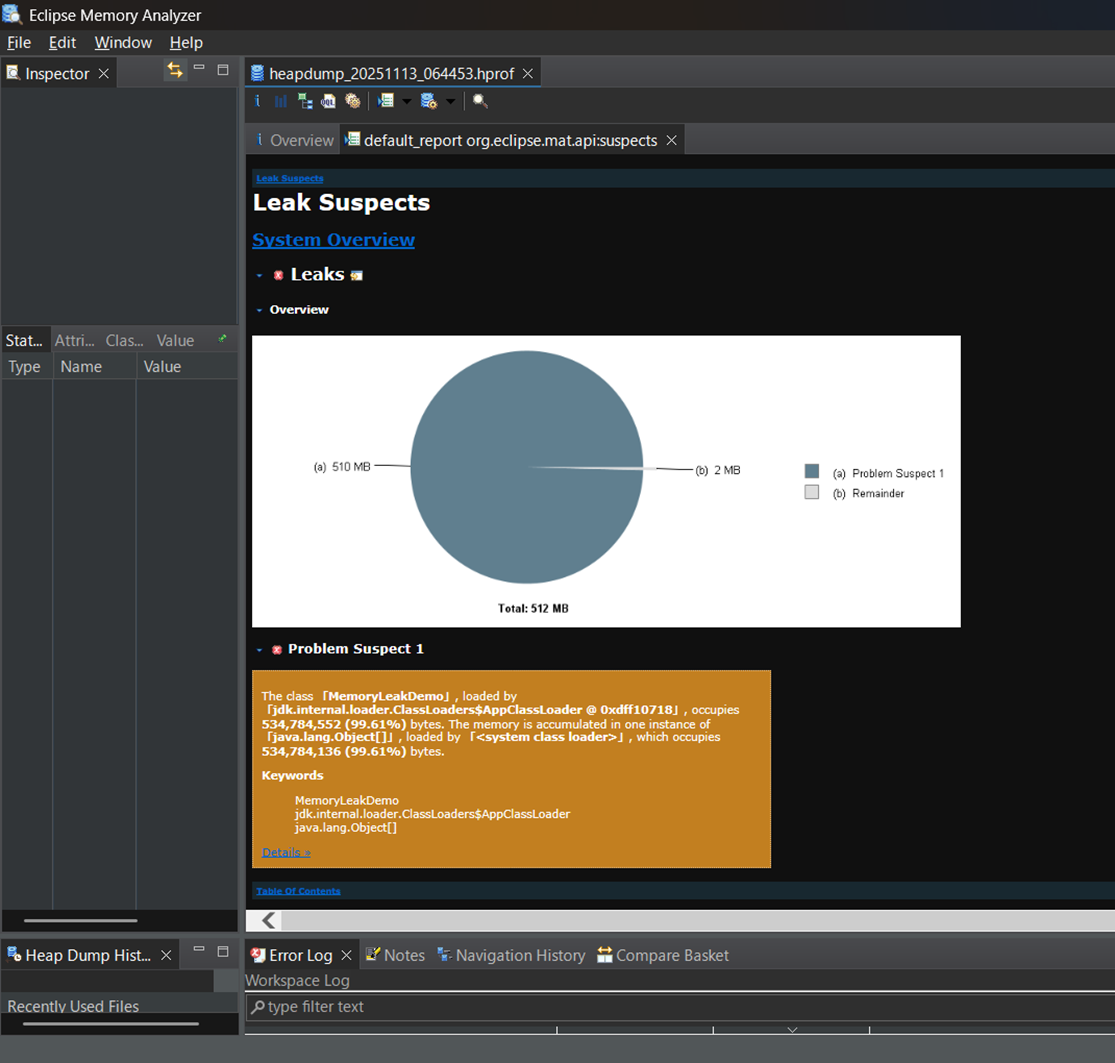
When you open an .hprof file, the Leak Suspects report is generated automatically. First, review this report to get a high-level overview of the heap and to identify any abnormal objects or unusually large collections.
In this example, a sample program called MemoryLeakDemo is being executed, and it is clearly occupying a large portion of the heap, making the issue easy to identify.。
Histogram (Identifying Classes Consuming Memory)
Next, check the number of objects, Shallow Heap, and Retained Heap on a per-class basis to identify classes whose memory usage continues to grow.
Click Overview > Histogram.
A list of class names will be displayed, as shown below.
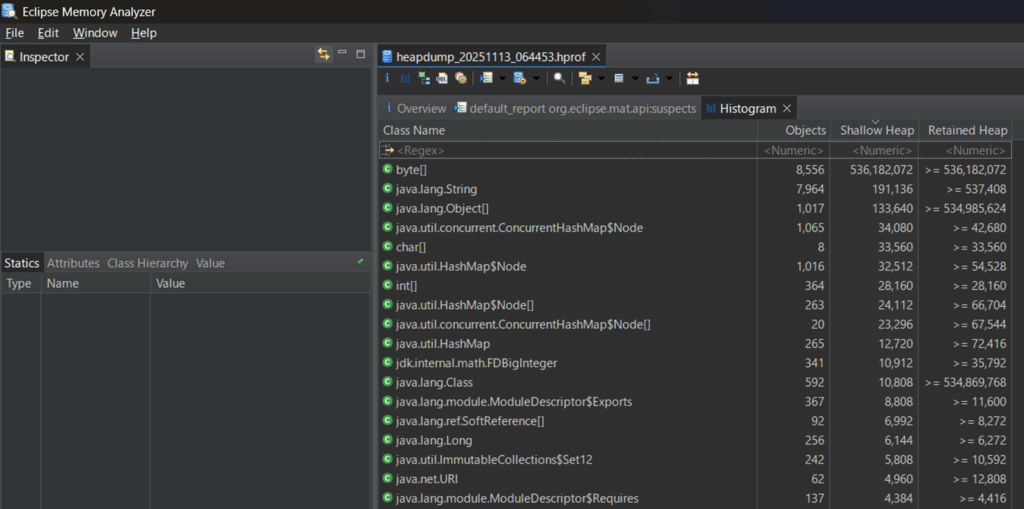
The meaning of each item is as follows:
- Objects
Indicates the number of instances (objects) of the class. Look for classes with an unusually large number of objects. - Shallow Heap
Shows the amount of memory (in bytes) consumed by the object itself on the heap. The sizes of referenced objects are not included. - Retained Heap
Represents the total amount of memory (in bytes) of the entire dependency graph, including objects that are retained (referenced) by the target object. This corresponds to the total memory size of the set of objects that would be freed together if the target object were garbage-collected. If you find objects with a large retained heap, they may indicate a potential memory leak and should be investigated further.
Next, once you identify a class with a large Retained Heap, examine its details.
Right-click the Class Name and select List Objects > with incoming references.
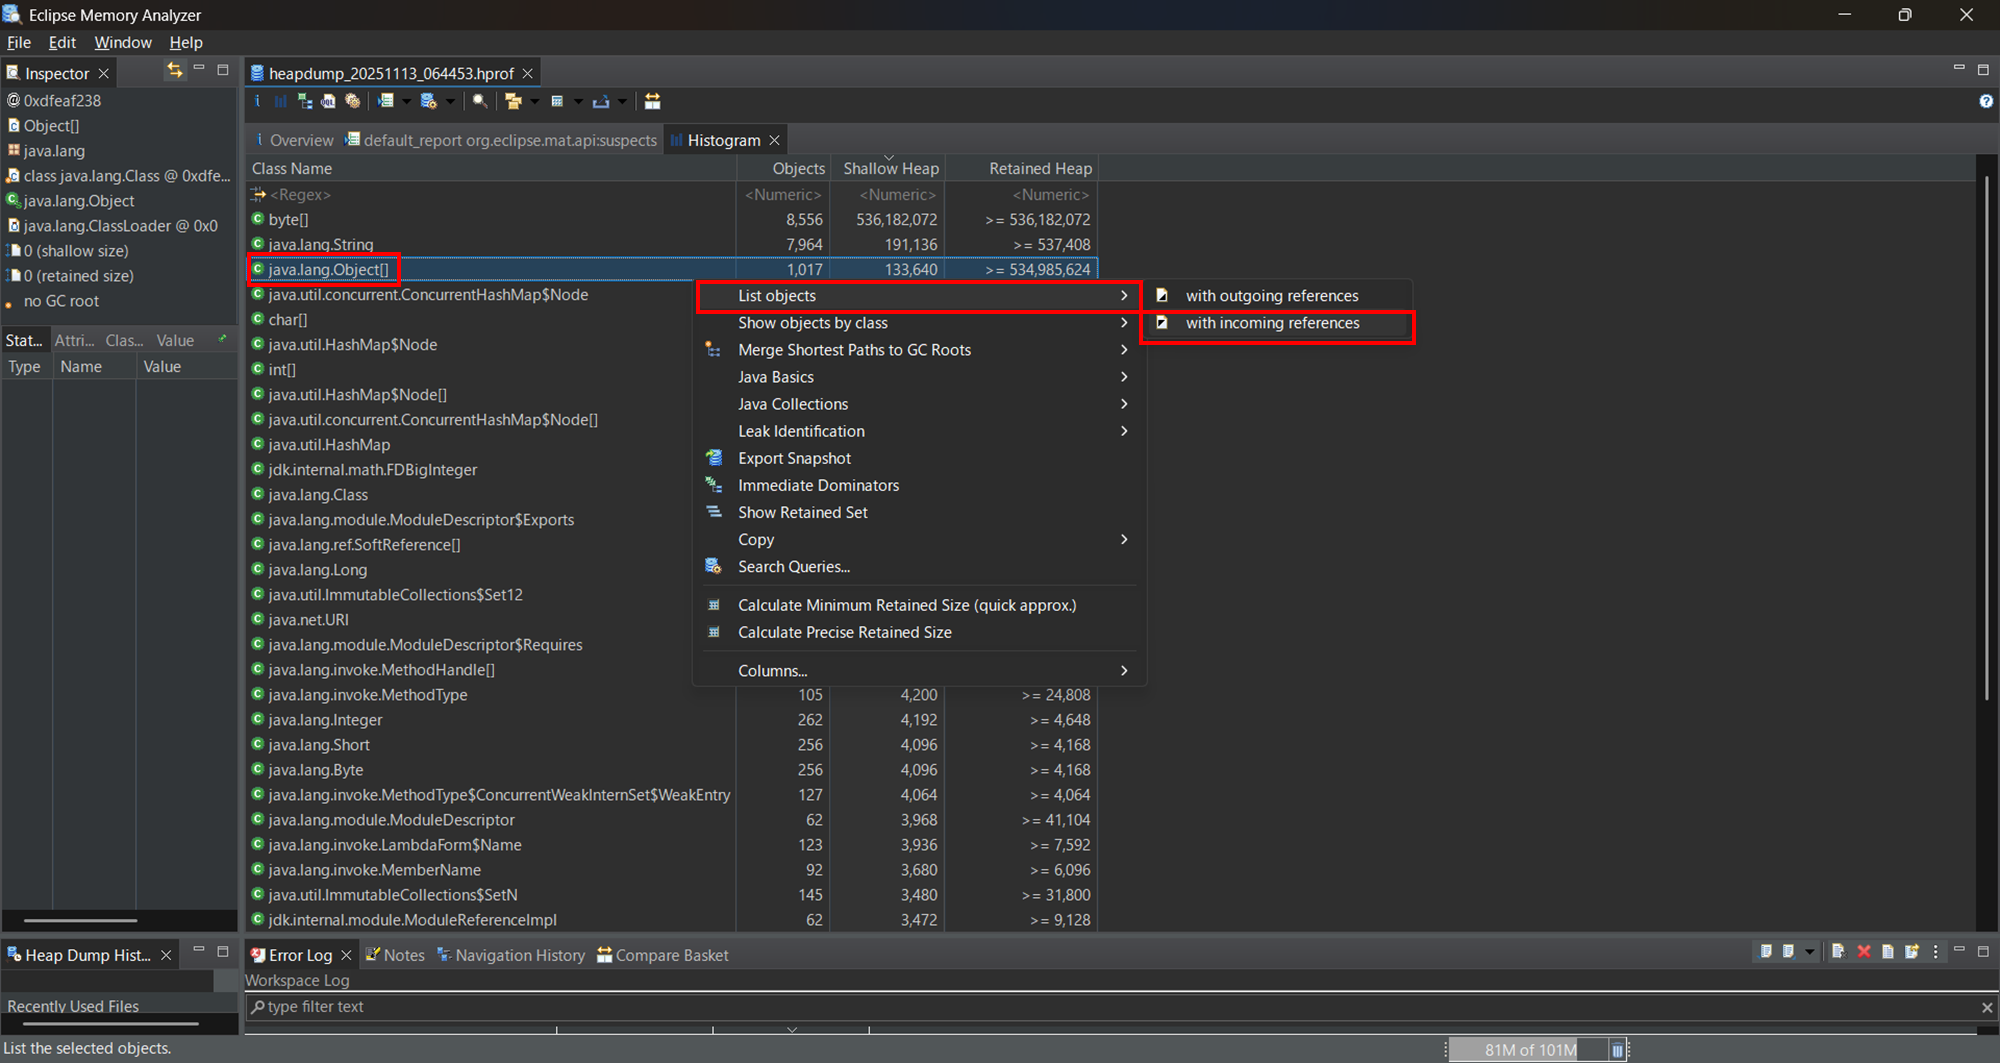
ncoming references are the objects that reference the target object. By checking which objects are holding these references, you can identify the root cause of the memory leak.
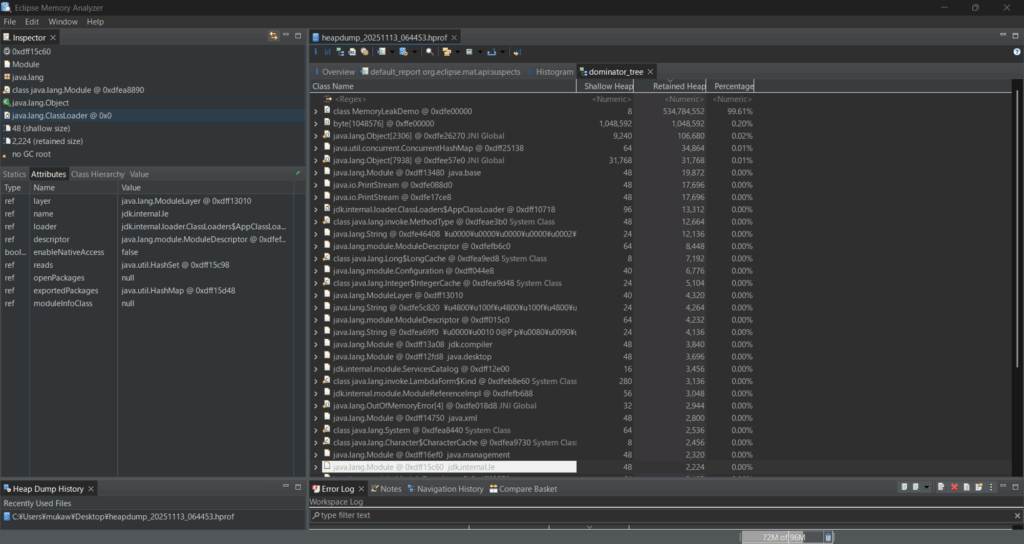
Dominator Tree (Identifying What Is Retaining the Class and the Root Cause)
By examining classes with a large Retained Heap, you can identify the causes of memory that cannot be freed and is being retained in large amounts. In this case, it is clearly evident that the MemoryLeakDemo class is holding a significant amount of memory.
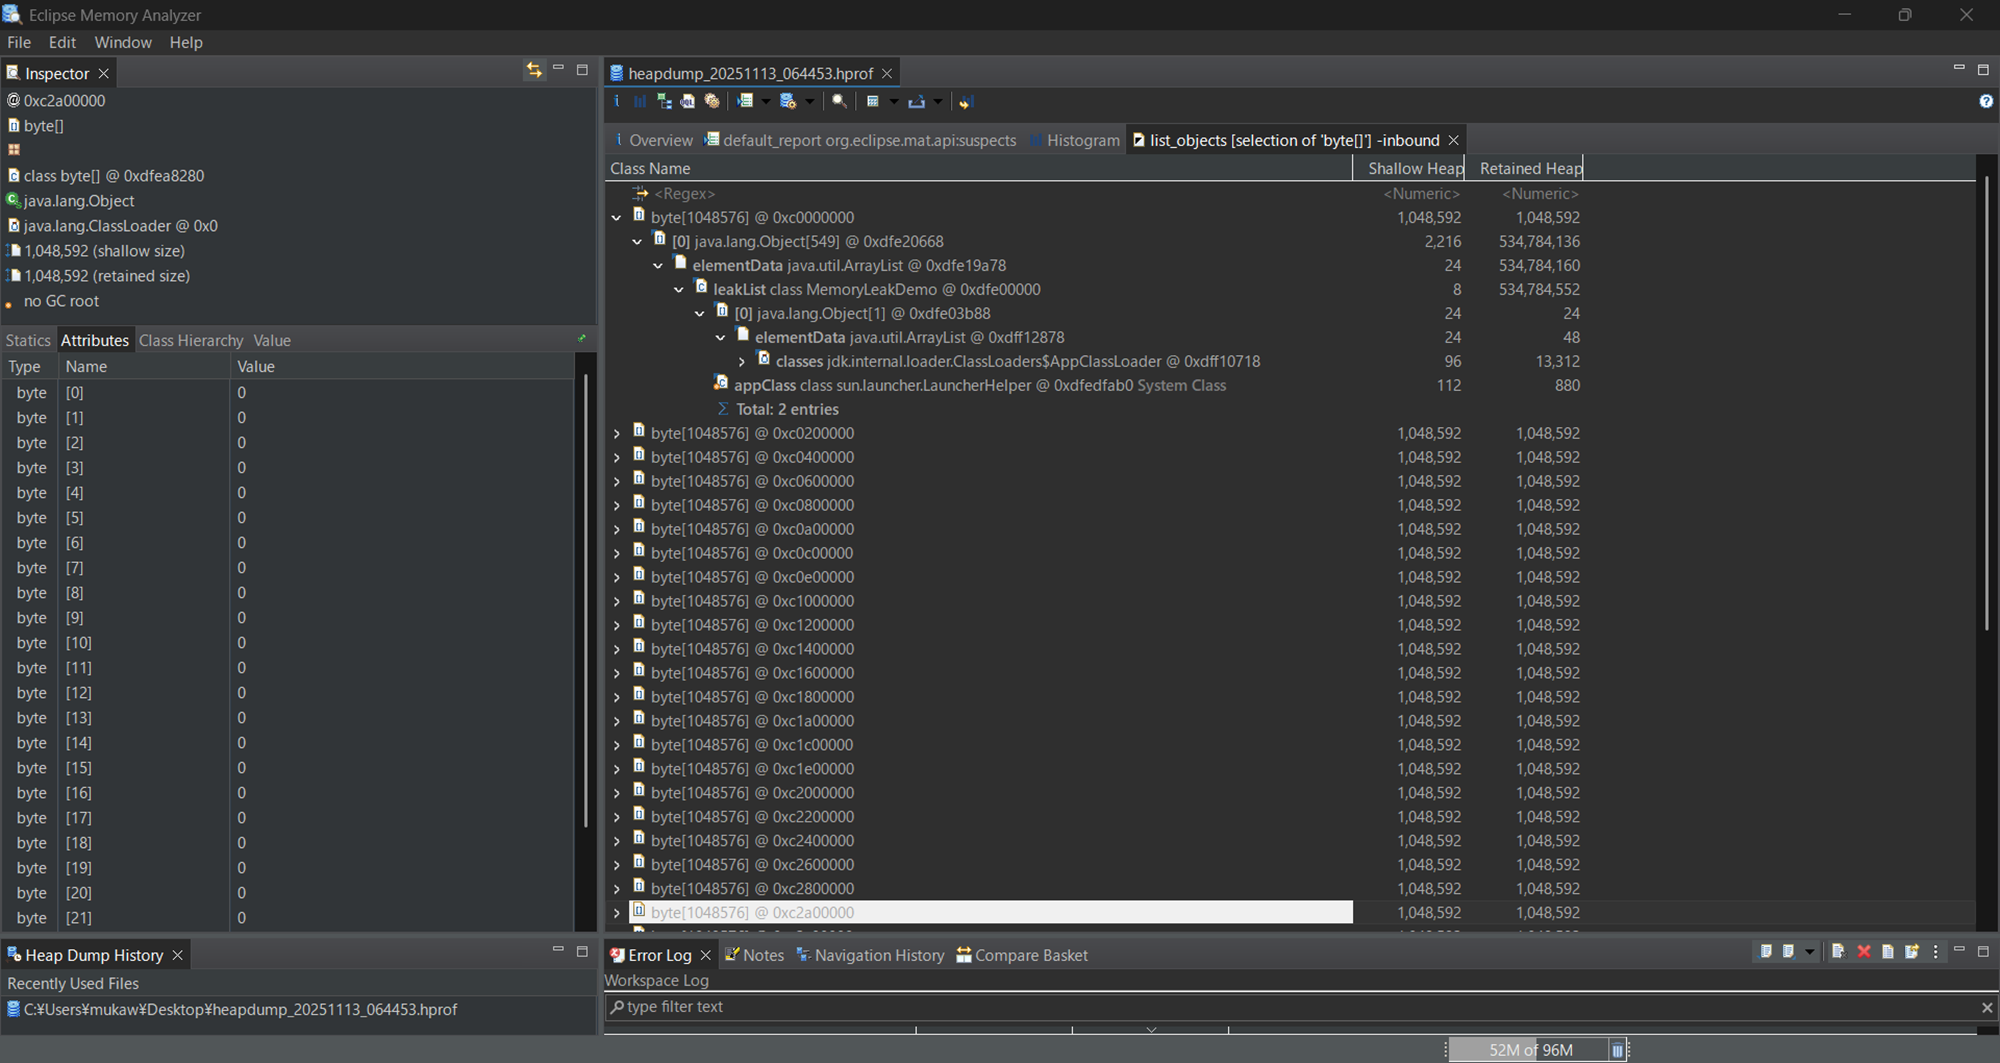
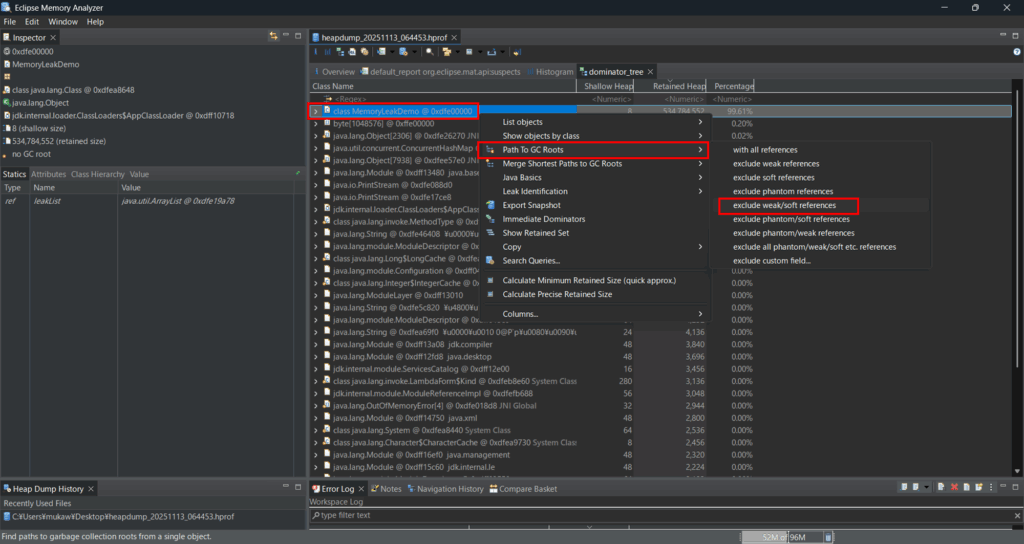
Path to GC Roots (Confirming the Reference Chain and Identifying the Root Cause)
After identifying a suspicious class in the Dominator Tree, check the Path to GC Roots. This allows you to determine why the objects cannot be garbage-collected.
Right-click the target class and select Path to GC Roots > exclude weak/soft references.
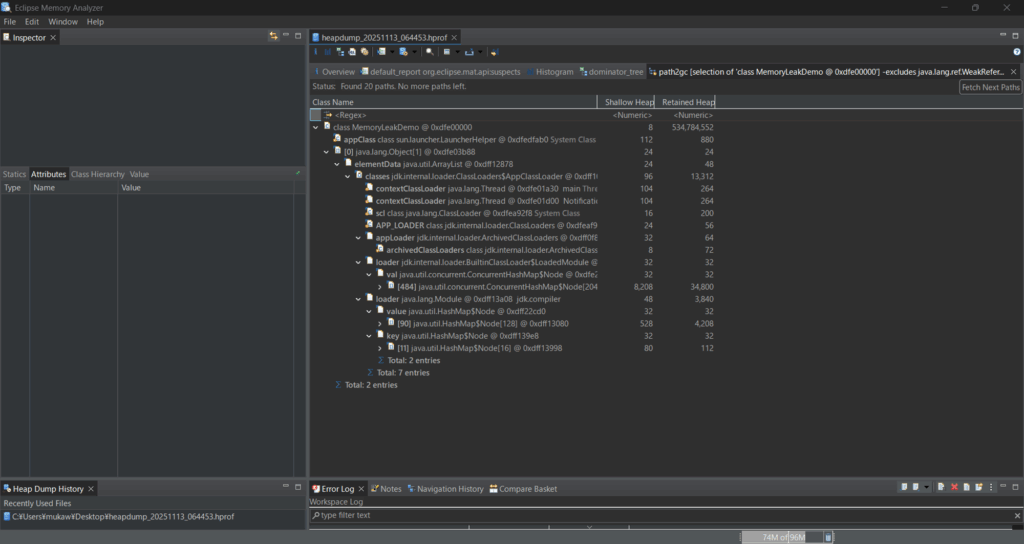
Since elementData java.util.ArrayList @ 0xdff1e878 is shown, we can conclude that the following situation is occurring:
- An ArrayList inside MemoryLeakDemo is retaining a large number of objects
- ArrayList.elementData[] has grown into a very large array
- This array is not being freed by the GC, which is the fundamental cause of the memory leak
How to Obtain and Analyze a Core Dump
If the root cause cannot be identified using thread dumps or heap dumps, consider obtaining a core dump as a last resort. Alternatively, if the JVM crashes, it is a good practice to configure the system to automatically generate a core dump. In this section, we explain the process using Tomcat as an example.
コアダンプの取得方法
Obtaining a Core Dump Using the gcore Command
By executing the gcore command, you can obtain a core dump without stopping the JVM process.
[root@quiz ~]# gcore -o /var/tomcat 311127
[New LWP 311252]
[New LWP 311188]
~~Truncated~~
[New LWP 311129]
[New LWP 311128]
[Thread debugging using libthread_db enabled]
Using host libthread_db library "/lib64/libthread_db.so.1".
0x00007f1d8788717a in __futex_abstimed_wait_common () from /lib64/libc.so.6
warning: Memory read failed for corefile section, 4096 bytes at 0xffffffffff600000.
Saved corefile /var/tomcat.311127
[Inferior 1 (process 311127) detached]
[root@quiz ~]#
Automatically Generating a Core Dump on Abnormal JVM Termination
When the JVM terminates abnormally, configuring it to output a core dump can be very helpful for analysis. Add the necessary settings in advance to ensure that core dumps are generated. Please add the following configuration to the Tomcat startup options.
[root@quiz ~]# vi /etc/systemd/system/tomcat.service
[root@quiz ~]# cat /etc/systemd/system/tomcat.service
[Unit]
Description=Apache Tomcat 10
After=network.target
~~Truncated~~
##Core Dump Setting
LimitCORE=infinity
~~Truncated~~
[root@quiz ~]#
[root@quiz ~]# systemctl daemon-reload
[root@quiz ~]# systemctl restart tomcat
[root@quiz ~]#
Now, let’s try obtaining a core dump. Specify the Tomcat process ID and run the kill -SEGV command. After waiting for a short time, you should be able to confirm that a core dump has been generated.
[root@quiz ~]# kill -SEGV 300774
[root@quiz ~]#
[root@quiz ~]# coredumpctl list
No coredumps found.
-- Notice: 1 systemd-coredump@.service unit is running, output may be incomplete.
[root@quiz ~]# coredumpctl list
TIME                           PID UID GID SIG     COREFILE EXE                             SIZE
Wed 2025-12-03 06:56:52 JST 300774 996 993 SIGABRT present  /opt/java/jdk-21.0.2/bin/java 107.7M
[root@quiz ~]#
Next, let’s output the core dump to a file.
[root@quiz ~]# coredumpctl dump 300774 > /tmp/core-300774
           PID: 300774 (java)
           UID: 996 (tomcat)
           GID: 993 (tomcat)
        Signal: 6 (ABRT)
     Timestamp: Wed 2025-12-03 06:56:44 JST (1min 58s ago)
  Command Line: /opt/java/jdk-21.0.2/bin/java -Djava.util.logging.config.file=/opt/tomcat/conf/logging.properties -Djava.util.logging.manager=org.apache.juli.ClassLoaderLogManager -Djdk.tls.ephemeralDHKeySize=2048 -Djava.protocol.handler.pkgs=org.apache.catalina.webresources -Dsun.io.useCanonCaches=false -Dorg.apache.catalina.security.SecurityListener.UMASK=0027 --add-opens=java.base/java.lang=ALL-UNNAMED --add-opens=java.base/java.lang.reflect=ALL-UNNAMED --add-opens=java.base/java.io=ALL-UNNAMED --add-opens=java.base/java.util=ALL-UNNAMED --add-opens=java.base/java.util.concurrent=ALL-UNNAMED --add-opens=java.rmi/sun.rmi.transport=ALL-UNNAMED -Dcom.sun.management.jmxremote -Dcom.sun.management.jmxremote.port=9010 -Dcom.sun.management.jmxremote.rmi.port=9011 -Dcom.sun.management.jmxremote.authenticate=true -Dcom.sun.management.jmxremote.access.file=/opt/tomcat/conf/jmxremote.access -Dcom.sun.management.jmxremote.password.file=/opt/tomcat/conf/jmxremote.password -Dcom.sun.management.jmxremote.registry.ssl=false -Dcom.sun.management.jmxremote.ssl=false -Dcom.sun.management.jmxremote.local.only=false -Djava.rmi.server.hostname=quiz.eeengineer.com $'-Xlog:gc*,safepoint:file=/opt/tomcat/logs/gc.log:time,level,tags:filecount=5,filesize=10M' -XX:+HeapDumpOnOutOfMemoryError -XX:HeapDumpPath=/tmp/heapdump_20251203_064958.hprof -classpath /opt/tomcat/bin/bootstrap.jar:/opt/tomcat/bin/tomcat-juli.jar -Dcatalina.base=/opt/tomcat -Dcatalina.home=/opt/tomcat -Djava.io.tmpdir=/opt/tomcat/temp org.apache.catalina.startup.Bootstrap start
    Executable: /opt/java/jdk-21.0.2/bin/java
 Control Group: /system.slice/tomcat.service
          Unit: tomcat.service
         Slice: system.slice
       Boot ID: f945e8fb8a004dc0ba4b133ac7c2252c
    Machine ID: 49a9003f8f0e4a25a5bf4d147e21e0d4
      Hostname: quiz.eeengineer.com
       Storage: /var/lib/systemd/coredump/core.java.996.f945e8fb8a004dc0ba4b133ac7c2252c.300774.1764712604000000.zst (present)
  Size on Disk: 107.7M
       Message: Process 300774 (java) of user 996 dumped core.
                Module libverify.so without build-id.
                Module libextnet.so without build-id.
                Module libmanagement_ext.so without build-id.
                Module libmanagement.so without build-id.

 ~~Truncated~~
          #16 0x00007fdedc029680 __libc_start_main@@GLIBC_2.34 (libc.so.6 + 0x29680)
                #17 0x0000564ffc718b75 _start (java + 0xb75)
                ELF object binary architecture: AMD x86-64
[root@quiz ~]#
[root@quiz ~]# ll /tmp/core-300774
-rw-r--r-- 1 root root 585781248 Dec  3 06:58 /tmp/core-300774
[root@quiz ~]#
Precautions When Taking a Core Dump
Obtaining a core dump is effective because it captures the memory state of the entire process, providing more comprehensive information than thread dumps or heap dumps. However, for the reasons described below, taking a core dump on a production system is generally not recommended. If it is absolutely necessary, it should be performed during a planned service downtime, at a point where temporary suspension is acceptable, or during a low-traffic period.
- System load may increase during dump generation
Even when using gcore to obtain a core dump without stopping the process, the JVM’s entire memory space is copied during the operation. As a result, CPU and I/O load may temporarily increase. This impact becomes particularly noticeable for large JVMs (for example, those with heap sizes of several gigabytes or more). - The resulting file size can be extremely large
Because a core dump includes the JVM’s entire memory region, it can be even larger than a heap dump. Ensure that sufficient disk space is available, and it is recommended to output the dump to a dedicated directory that does not affect other services.
How to Analyze a Core Dump
Analysis Using the gdb Command
Core dump files obtained with the gcore command can be analyzed using the gdb command. gdb is short for GNU Debugger and is a native program debugging tool commonly used on Linux and UNIX-like systems.
[root@quiz ~]# gdb /opt/java/jdk-21.0.2/bin/java /var/tomcat.311127
GNU gdb (AlmaLinux) 16.3-2.el9
Copyright (C) 2024 Free Software Foundation, Inc.
License GPLv3+: GNU GPL version 3 or later <http://gnu.org/licenses/gpl.html>
This is free software: you are free to change and redistribute it.
There is NO WARRANTY, to the extent permitted by law.
Type "show copying" and "show warranty" for details.
~~Truncated~~
[New LWP 311129]
[New LWP 311128]
This GDB supports auto-downloading debuginfo from the following URLs:
  <%{dist_debuginfod_url}>
Enable debuginfod for this session? (y or [n])
Debuginfod has been disabled.
--Type <RET> for more, q to quit, c to continue without paging--
To make this setting permanent, add 'set debuginfod enabled off' to .gdbinit.
[Thread debugging using libthread_db enabled]
Using host libthread_db library "/lib64/libthread_db.so.1".
Core was generated by `/opt/java/jdk-21.0.2/bin/java -Djava.util.logging.config.file=/opt/tomcat/conf/logging.properties -Djava.util.logging.manager=org.apache.juli.ClassLoaderLogManager -Djdk.tls.ephemeralDHKeySize=2048 -Djava.protocol.handler.pkgs=org.apache.catalina.webresources -Dsun.io.useCanonCaches=false -Dorg.apache.catalina.security.SecurityListener.UMASK=0027 --add-opens=java.base/java.lang=ALL-UNNAMED --add-opens=java.base/java.lang.reflect=ALL-UNNAMED --add-opens=java.base/java.io=ALL-UNNAMED --add-opens=java.base/java.util=ALL-UNNAMED --add-opens=java.base/java.util.concurrent=ALL-UNNAMED --add-opens=java.rmi/sun.rmi.transport=ALL-UNNAMED -Dcom.sun.management.jmxremote -Dcom.sun.management.jmxremote.port=9010 -Dcom.sun.management.jmxremote.rmi.port=9011 -Dcom.sun.management.jmxremote.authenticate=true -Dcom.sun.management.jmxremote.access.file=/opt/tomcat/conf/jmxremote.access -Dcom.sun.management.jmxremote.password.file=/opt/tomcat/conf/jmxremote.password -Dcom.sun.management.jmxremote.registry.ssl=false -Dcom.sun.management.jmxremote.ssl=false -Dcom.sun.management.jmxremote.local.only=false -Djava.rmi.server.hostname=quiz.eeengineer.com -Xlog:gc\*,safepoint:file=/opt/tomcat/logs/gc.log:time,level,tags:filecount=5,filesize=10M -XX:+HeapDumpOnOutOfMemoryError -XX:HeapDumpPath=/tmp/heapdump_20251203_161446.hprof -classpath /opt/tomcat/bin/bootstrap.jar:/opt/tomcat/bin/tomcat-juli.jar -Dcatalina.base=/opt/tomcat -Dcatalina.home=/opt/tomcat -Djava.io.tmpdir=/opt/tomcat/temp org.apache.catalina.startup.Bootstrap start'.
#0  0x00007f1d8788717a in __futex_abstimed_wait_common () from /lib64/libc.so.6
[Current thread is 1 (Thread 0x7f1d87ae4200 (LWP 311127))]
Missing rpms, try: dnf --enablerepo='*debug*' install zlib-debuginfo-1.2.11-40.el9.x86_64 glibc-debuginfo-2.34-168.el9_6.14.alma.1.x86_64 sssd-client-debuginfo-2.9.6-4.el9_6.2.x86_64
(gdb)
When the (gdb) prompt is displayed, you can enter commands interactively to obtain the required information. Commonly used commands include the following:
- bt: Displays a backtrace (the function call history at the time of the crash)
- info threads: Displays a list of threads in the process
- thread <number>: Switches to the specified thread
- list: Displays the source code
- print <variable>: Shows the value of a variable
- quit: Exits gdb
(gdb) info thread
  Id   Target Id                          Frame
* 1    Thread 0x7f1d87ae4200 (LWP 311127) 0x00007f1d8788717a in __futex_abstimed_wait_common () from /lib64/libc.so.6
  2    Thread 0x7f1d599f9640 (LWP 311252) 0x00007f1d8790f91f in accept () from
  ~~Truncated~~
 42   Thread 0x7f1d8494b640 (LWP 311129) 0x00007f1d8788717a in __futex_abstimed_wait_common () from /lib64/libc.so.6
  43   Thread 0x7f1d861ff640 (LWP 311128) 0x00007f1d8790f91f in accept () from /lib64/libc.so.6
(gdb)
(gdb) bt
#0  0x00007f1d8788717a in __futex_abstimed_wait_common () from /lib64/libc.so.6
#1  0x00007f1d8788bbf4 in __pthread_clockjoin_ex () from /lib64/libc.so.6
#2  0x00007f1d87af7a2f in CallJavaMainInNewThread () from /opt/java/jdk-21.0.2/bin/../lib/libjli.so
#3  0x00007f1d87af4bbd in ContinueInNewThread () from /opt/java/jdk-21.0.2/bin/../lib/libjli.so
#4  0x00007f1d87af560d in JLI_Launch () from /opt/java/jdk-21.0.2/bin/../lib/libjli.so
#5  0x0000556d450f7adf in main ()
(gdb)
Reference
For reference, we share a sample program that intentionally causes performance issues.
A Java Program That Causes a Memory Leak
Below is a Java program that is intentionally designed to cause a memory leak for learning purposes. If you would like to understand the behavior hands-on, please feel free to try it out yourself.
import java.util.ArrayList;
import java.util.List;
public class MemoryLeakDemo {
    private static final List<Object> leakList = new ArrayList<>();
    public static void main(String[] args) {
        System.out.println("Starting MemoryLeakDemo...");
        try {
            while (true) {
                // 1MBのbyte配列を生成してリストに追加
                byte[] data = new byte[1024 * 1024];
                leakList.add(data);
                // 現在のリストサイズを出力
                System.out.println("Objects in list: " + leakList.size());
                // 少し待つ(CPU負荷軽減)
                Thread.sleep(100);
            }
        } catch (OutOfMemoryError e) {
            System.err.println("OutOfMemoryError発生!");
            e.printStackTrace();
        } catch (InterruptedException e) {
            e.printStackTrace();
        }
    }
}
Create the above file with the name MemoryLeakDemo.java, and run it as shown below.
[root@quiz tmp]# vi MemoryLeakDemo.java
[root@quiz tmp]# cat MemoryLeakDemo.java
import java.util.ArrayList;
import java.util.List;
public class MemoryLeakDemo {
    private static final List<Object> leakList = new ArrayList<>();
    public static void main(String[] args) {
        System.out.println("Starting MemoryLeakDemo...");
        try {
            while (true) {
                byte[] data = new byte[1024 * 1024];
                leakList.add(data);
                System.out.println("Objects in list: " + leakList.size());
                Thread.sleep(100);
            }
        } catch (OutOfMemoryError e) {
            System.err.println("OutOfMemoryError発生!");
            e.printStackTrace();
        } catch (InterruptedException e) {
            e.printStackTrace();
        }
    }
}
[root@quiz tmp]#
[root@quiz tmp]# javac MemoryLeakDemo.java
[root@quiz tmp]# java MemoryLeakDemo
Starting MemoryLeakDemo...
Objects in list: 1
Objects in list: 2
Objects in list: 3
Objects in list: 4
Objects in list: 5
A Java Program That Causes a Deadlock
[root@quiz ~]# cd /tmp/
[root@quiz tmp]# vi /tmp/DeadlockSample.java
[root@quiz tmp]# cat /tmp/DeadlockSample.java
/**
 * This program intentionally causes a deadlock between two threads.
 * It is useful for testing thread dumps, heap dumps, and monitoring tools.
 */
public class DeadlockSample {
    private static final Object LOCK_A = new Object();
    private static final Object LOCK_B = new Object();
    public static void main(String[] args) {
        // Thread 1 tries to lock A then lock B
        Thread t1 = new Thread(() -> {
            synchronized (LOCK_A) {
                System.out.println("Thread-1: Acquired LOCK_A");
                sleep(100); // small delay to increase the chance of deadlock
                System.out.println("Thread-1: Waiting for LOCK_B...");
                synchronized (LOCK_B) {
                    System.out.println("Thread-1: Acquired LOCK_B");
                }
            }
        });
        // Thread 2 tries to lock B then lock A
        Thread t2 = new Thread(() -> {
            synchronized (LOCK_B) {
                System.out.println("Thread-2: Acquired LOCK_B");
                sleep(100); // small delay to increase the chance of deadlock
                System.out.println("Thread-2: Waiting for LOCK_A...");
                synchronized (LOCK_A) {
                    System.out.println("Thread-2: Acquired LOCK_A");
                }
            }
        });
        // Start both threads
        t1.start();
        t2.start();
    }
    /**
     * Helper method to sleep without throwing checked exceptions.
     */
    private static void sleep(long ms) {
        try {
            Thread.sleep(ms);
        } catch (InterruptedException e) {
            // Ignore interruptions for this test program
        }
    }
}
[root@quiz tmp]#
[root@quiz tmp]# javac DeadlockSample.java
[root@quiz tmp]# java DeadlockSample
Thread-1: Acquired LOCK_A
Thread-2: Acquired LOCK_B
Thread-1: Waiting for LOCK_B...
Thread-2: Waiting for LOCK_A...
Summary
Java application performance issues can manifest in various ways, such as response latency, reduced throughput, and high CPU or memory utilization. To accurately identify the root cause of these issues, it is important to select and use the appropriate type of dump depending on the situation.
- Thread Dump
- Allows you to inspect the state and lock information of each thread.
- Effective for identifying deadlocks and threads that are blocked or waiting.
- Lightweight and easy to capture, making it relatively safe to use even in production environments.
- Heap Dump
- A snapshot of the entire memory used by the JVM.
- Useful for analyzing memory leaks and excessive object retention.
- Capturing a heap dump may temporarily pause the application, so extra caution is required when collecting it in production.
- Core Dump
- Generated when the JVM or native code crashes unexpectedly.
- Enables analysis of JVM internal failures and OS-level state at the time of the crash.
- Requires specialized knowledge to capture and analyze, and is typically used as a last resort.
Since each type of dump has different characteristics and collection costs, choosing the appropriate dump based on the nature of the problem and the operating environment is essential. Combining multiple types of dumps during analysis can significantly help with root cause identification and preventing recurrence of performance issues.


コメント