
Introduction
In the operation of production systems, sudden spikes in CPU usage on Linux servers are by no means uncommon. In some cases, CPU load is just a temporary spike, but in others it can escalate into application failures or service outages, directly impacting the business.
However, even when high CPU usage is detected, it is not easy to quickly determine and respond appropriately to questions such as:
- Which process is causing the issue?
- Is the root cause the application, or the OS / middleware?
- What immediate mitigation can be taken, and how can the root cause be identified?
Making these judgments and taking the right actions under time pressure is challenging.
In this article, we will explain practical and reliable troubleshooting techniques that are truly useful for engineers responsible for the stable operation of production systems.
Impact of High CPU Usage
CPU usage is a metric that indicates how much of the CPU is being consumed by processes performing computational work on the system. When a high CPU load persists for an extended period of time, it can lead to the following issues, making prompt action essential:
- Application response slowdowns and timeouts
- Delays, timeouts, or abnormal termination of batch jobs
- Sluggish SSH connections, making it difficult or impossible to execute commands
- In the worst case, complete server downtime
Investigation Procedure During High CPU Usage
In production systems, CPU usage is typically monitored by monitoring tools. This section explains the investigation steps to follow when CPU usage exceeds a defined threshold.
Collect an Overview of CPU Usage
First, let’s check the overall CPU usage of the operating system. The following commands will be explained.
top Command
The top command is useful for reviewing an overview of CPU usage. With the top command, you can check the following information:
[root@quiz ~]# top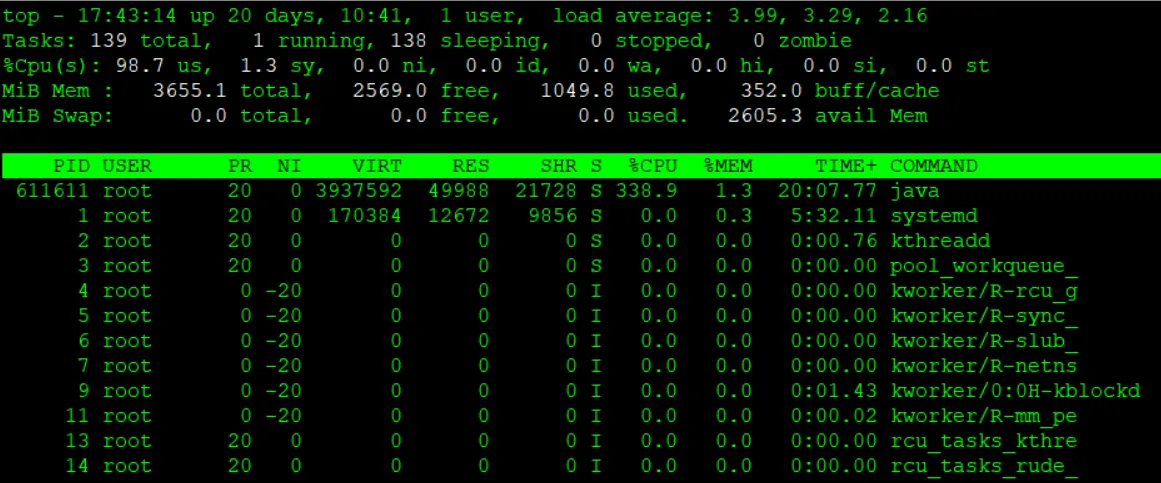
- load average
This shows the system load over the past 1, 5, and 15 minutes. In this example, the system has 4 logical CPU cores, and the load average is close to 4, indicating that the CPU is under heavy load.
Note : How to check the number of logical CPU cores
You can check the number of logical CPU cores by looking at the CPU(s): field in the output of the lscpu command, or by using the nproc command.
Alternatively, after running the top command, you can press 1 to display the number of CPU cores and the usage of each individual core, as shown below.
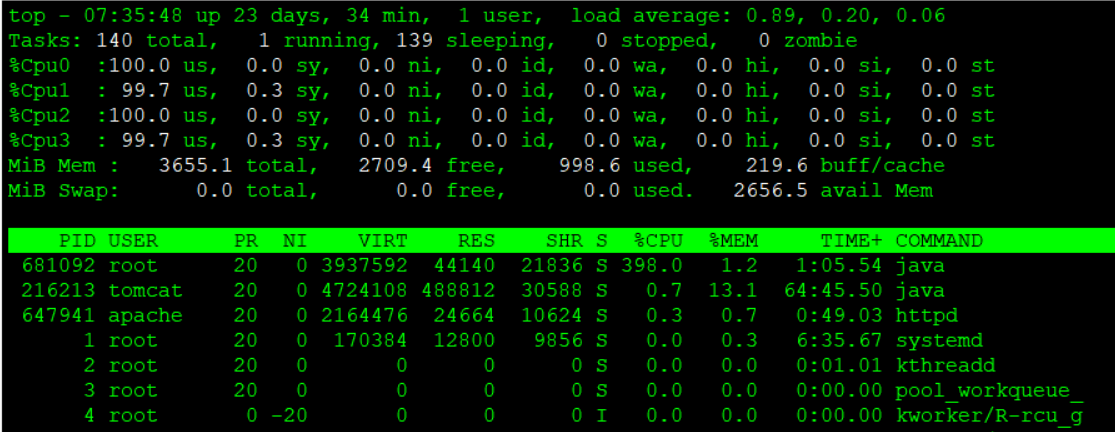
- %CPU(s)
Let’s review the CPU usage breakdown. The meaning of each field is as follows:- us (user)
Percentage of CPU time spent running normal user processes (non-kernel mode). - sy (system)
Percentage of CPU time spent running kernel (OS) processes. - ni (nice)
Percentage of CPU time used by user processes whose priority has been changed using nice. - id (idle)
Percentage of time the CPU is idle (not doing any work). First, check the value of id. Since CPU usage can be approximated as 100 − id, in this example the CPU usage is close to 100%. - wa (iowait)
Percentage of time the CPU is idle while waiting for I/O operations such as disk or network access. - hi (hardware interrupt)
Percentage of CPU time spent handling hardware interrupts. - si (software interrupt)
Percentage of CPU time spent handling software interrupts. - st (steal time)
Percentage of time the CPU is waiting because resources are being taken by other virtual machines in a virtualized environment.
- us (user)
Note: Even when CPU usage appears high, the load average may be low in some cases. In such situations, the system is often spending a long time waiting for I/O, so you should check I/O-related resources.
Identifying the Root Cause of High CPU Usage
If high CPU usage persists, the next step is to identify the root cause. Examine CPU usage on a per-process or per-thread basis.
top Command
When you run the top command, process information is displayed in descending order of CPU usage. If you find a process consuming significantly more resources than usual, review its details and analyze the underlying cause.
各項目のCPUに関連する項目は以下の通りです。
- PID (Process ID)
A unique identifier assigned to each process. - USER (Executing User)
The username under which the process is running. - PR (Priority)
The scheduling priority of the process (lower values indicate higher priority). - NI (Nice value)
A user-configurable priority adjustment for the process (range: -20 to 19). - S (Process State)
R = running, S = sleeping, D = uninterruptible sleep, Z = zombie, T = stopped. - %CPU (CPU Usage)
The percentage of CPU consumed by the process. Since this is shown on a per-thread basis, the total can exceed 100% in multi-core environments, as in this example. - TIME+ (Cumulative CPU Time)
The total CPU time consumed by the process so far (in seconds). In systems with multiple CPU cores, this value represents the sum of CPU time actually consumed across all cores. - COMMAND
The name or path of the command used to start the process.
In this example, the Java process with PID 611611 is showing high CPU usage, so let’s investigate the cause of the CPU spike related to Java.
In systems running Java applications or other multithreaded programs, it is sometimes not possible to identify the root cause by looking only at CPU usage at the process level. As shown below, you can add the -H option to the top command to display resource usage on a per-thread basis.
Here, we will check the per-thread resource usage of the Java process that was identified earlier as consuming a large amount of CPU using the top command.
[root@quiz ~]# top -H -p 611086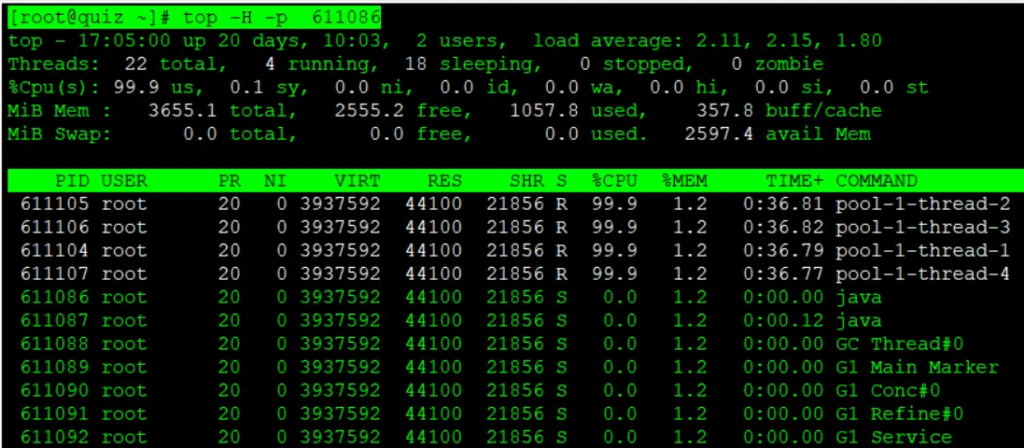
ps command
The information you can obtain with the ps command is largely the same as with the top command, but ps can also be used to retrieve CPU-related information in a similar way. By adding the –sort -%cpu option, you can identify processes that are consuming a large amount of CPU.
[root@quiz ~]# ps aux --sort -%cpu
USER         PID %CPU %MEM    VSZ   RSS TTY      STAT START   TIME COMMAND
root      611440  387  1.1 3937592 44148 pts/0   Sl+  17:31   2:15 java -cp . CPUHog 4
root      611498  2.3  0.1  16628  6528 pts/1    S    17:32   0:00 su -
root      611462  1.6  0.2  20148 11136 ?        Ss   17:32   0:00 sshd: eeengineer [priv]
root      611369  1.0  0.3  20148 11520 ?        Ss   17:31   0:00 sshd: eeengineer [priv]
root      611411  0.7  0.1  16628  6528 pts/0    S    17:31   0:00 su -
tomcat    216213  0.3 12.9 4724108 484260 ?      Sl   Oct19  55:55 /opt/java/jdk-21.0.2/bin/java -Djava.util.logging.config.file=/
root      611475  0.3  0.2  19068  8192 ?        Ss   17:32   0:00 /usr/lib/systemd/systemd-hostnamed
eeengin+  611373  0.1  0.3  21604 11392 ?        Ss   17:31   0:00 /usr/lib/systemd/systemd --user
pidstat command
By running the pidstat command, you can monitor per-process and per-thread information over time. First, let’s collect pidstat data at one-second intervals.
[root@quiz ~]# pidstat 1
Linux 5.14.0-570.19.1.el9_6.x86_64 (quiz.eeengineer.com)        11/02/2025      _x86_64_        (4 CPU)
06:20:21 AM   UID       PID    %usr %system  %guest   %wait    %CPU   CPU  Command
06:20:22 AM    26    216415    0.00    0.98    0.00    0.00    0.98     2  postmaster
06:20:22 AM     0    707117    0.00    0.98    0.00    0.00    0.98     3  pidstat
06:20:22 AM   UID       PID    %usr %system  %guest   %wait    %CPU   CPU  Command
06:20:23 AM   996    216213    1.00    0.00    0.00    0.00    1.00     2  java
06:20:23 AM     0    706742    0.00    1.00    0.00    0.00    1.00     1  kworker/u16:0-events_unbound
06:20:23 AM     0    707117    1.00    0.00    0.00    0.00    1.00     3  pidstat
06:20:23 AM   UID       PID    %usr %system  %guest   %wait    %CPU   CPU  Command
06:20:24 AM   996    216213    0.00    1.00    0.00    0.00    1.00     2  java
06:20:24 AM     0    707117    0.00    1.00    0.00    0.00    1.00     3  pidstat
You can narrow down the data collection to a specific PID.
[root@quiz ~]# pidstat -p 707126 1
Linux 5.14.0-570.19.1.el9_6.x86_64 (quiz.eeengineer.com)        11/02/2025      _x86_64_        (4 CPU)
06:29:03 AM   UID       PID    %usr %system  %guest   %wait    %CPU   CPU  Command
06:29:04 AM     0    707126  397.00    0.00    0.00    0.00  397.00     0  java
06:29:05 AM     0    707126  400.00    0.00    0.00    0.00  400.00     0  java
06:29:06 AM     0    707126  399.00    1.00    0.00    0.00  400.00     0  java
06:29:07 AM     0    707126  399.00    0.00    0.00    0.00  399.00     0  java
06:29:08 AM     0    707126  400.00    0.00    0.00    0.00  400.00     0  java
06:29:09 AM     0    707126  399.00    0.00    0.00    0.00  399.00     0  java
It is also possible to retrieve information on a per-thread basis.
[root@quiz ~]# pidstat -t 1
Linux 5.14.0-570.19.1.el9_6.x86_64 (quiz.eeengineer.com)        11/02/2025      _x86_64_        (4 CPU)
06:30:03 AM   UID      TGID       TID    %usr %system  %guest   %wait    %CPU   CPU  Command
06:30:05 AM    48    699715         -    0.00    0.85    0.00    0.00    0.85     1  httpd
06:30:05 AM     0    707126         -  359.32    0.00    0.00    0.00  359.32     0  java
06:30:05 AM     0         -    707133    0.85    0.00    0.00    0.00    0.85     0  |__VM Periodic Tas
06:30:05 AM     0         -    707144   89.83    0.00    0.00    0.85   89.83     0  |__pool-1-thread-1
06:30:05 AM     0         -    707145   87.29    0.00    0.00    3.39   87.29     2  |__pool-1-thread-2
06:30:05 AM     0         -    707146   90.68    0.85    0.00    0.00   91.53     1  |__pool-1-thread-3
06:30:05 AM     0         -    707147   89.83    0.00    0.00    0.85   89.83     3  |__pool-1-thread-4
06:30:05 AM     0    707280         -    0.85    1.69    0.00    1.69    2.54     2  pidstat
06:30:05 AM     0         -    707280    0.85    1.69    0.00    1.69    2.54     2  |__pidstat
06:30:05 AM   UID      TGID       TID    %usr %system  %guest   %wait    %CPU   CPU  Command
06:30:06 AM     0    707126         -  397.00    0.00    0.00    0.00  397.00     0  java
06:30:06 AM     0         -    707144  100.00    0.00    0.00    0.00  100.00     0  |__pool-1-thread-1
06:30:06 AM     0         -    707145   96.00    0.00    0.00    4.00   96.00     2  |__pool-1-thread-2
06:30:06 AM     0         -    707146  100.00    0.00    0.00    0.00  100.00     1  |__pool-1-thread-3
06:30:06 AM     0         -    707147  101.00    0.00    0.00    0.00  101.00     3  |__pool-1-thread-4
06:30:06 AM     0    707280         -    3.00    2.00    0.00    3.00    5.00     2  pidstat
06:30:06 AM     0         -    707280    3.00    2.00    0.00    3.00    5.00     2  |__pidstat
Checking Various Logs
While it is essential to first understand resource usage using commands such as top, you should then review various logs to identify the root cause.
OS Logs
Check the logs output by the Linux OS. Below are examples for RHEL-based systems.
- /var/log/messages
This file contains general OS logs. For example, you may see entries like the following:- INFO: task : blocked for more than 120 seconds
This indicates that a process has been blocked in a runnable state for more than 120 seconds. It suggests that, for some reason, the process is unable to use the CPU or is waiting for I/O. - kernel: soft lockup – CPU#1 stuck for 22s! [process:1234]
This indicates that the CPU has entered a soft lockup state. The CPU is unable to switch tasks, and the system may appear partially frozen. - kernel: Watchdog detected hard LOCKUP on cpu 2
This indicates that the CPU has entered a hard lockup state. The CPU is completely frozen and cannot respond even to interrupts.
- INFO: task : blocked for more than 120 seconds
Note: If systemd journal is used, check the logs with commands such as journalctl -xe.
- /var/log/cron
This log records the execution of cron jobs. While it does not directly identify the cause of high CPU usage, checking the timing of cron executions may help indirectly pinpoint the cause.
Web Server Logs
By reviewing web server logs, you can check whether the request volume or the number of errors has increased suddenly. Note that log output directories vary depending on system design, so please adjust the paths according to your environment.
- Access Logs
Check /var/log/httpd/access_log (Apache) or /var/log/nginx/access.log (Nginx) to see whether the number of records is significantly higher than usual, or whether requests are concentrated on specific URLs. In recent years, DDoS attacks have become more common, and even if there are no issues on the system itself, resource usage may spike rapidly, potentially leading to system downtime. - Error Logs
Check /var/log/httpd/error_log (Apache) or /var/log/nginx/error.log (Nginx) to determine whether errors are being generated. If a large number of errors are logged, they may be a potential cause of increased CPU usage.
Application Server Logs
Information output in application server logs can sometimes help identify the cause of increased CPU usage. Here, let’s take Tomcat as an example.
- catalina.out
This log contains Tomcat’s standard output and standard error. If Java stack traces are present or the same log messages are being output repeatedly in large volumes, they may be a cause of increased CPU usage and should be reviewed. - gc.log
In some cases, increased CPU usage is caused by garbage collection (GC). By reviewing GC-related logs, you can check whether GC is occurring more frequently than usual or whether GC processing times have become longer, both of which warrant further investigation.
Note: Enabling gc.log in Tomcat
By default, GC-related logs are not output in Tomcat. It is recommended to add the appropriate JVM options so that gc.log is enabled and available for analysis.
[root@quiz ~]# vi /opt/tomcat/bin/setenv.sh
[root@quiz ~]# cat /opt/tomcat/bin/setenv.sh
~~Omitted~~
## GC Log Setting
-Xlog:gc*,safepoint:file=$CATALINA_BASE/logs/gc.log:time,level,tags:filecount=5,filesize=10M"
[root@quiz ~]#
[root@quiz ~]# systemctl restart tomcat
[root@quiz ~]#
If GC-related logs are output as shown below, the configuration has been applied successfully. In the following example, you can see that minor GCs are occurring within a normal range.
[2025-11-03T21:57:11.276+0900][info][safepoint   ] Safepoint "ICBufferFull", Time since last: 894905347 ns, Reaching safepoint: 7277 ns, Cleanup: 159379 ns, At safepoint: 3260 ns, Total: 169916 ns
[2025-11-03T21:57:11.352+0900][info][gc,start    ] GC(0) Pause Young (Normal) (G1 Evacuation Pause)
[2025-11-03T21:57:11.353+0900][info][gc,task     ] GC(0) Using 2 workers of 4 for evacuation
[2025-11-03T21:57:11.389+0900][info][gc,phases   ] GC(0)   Pre Evacuate Collection Set: 0.3ms
[2025-11-03T21:57:11.389+0900][info][gc,phases   ] GC(0)   Merge Heap Roots: 0.2ms
[2025-11-03T21:57:11.389+0900][info][gc,phases   ] GC(0)   Evacuate Collection Set: 31.4ms
[2025-11-03T21:57:11.389+0900][info][gc,phases   ] GC(0)   Post Evacuate Collection Set: 2.0ms
[2025-11-03T21:57:11.389+0900][info][gc,phases   ] GC(0)   Other: 0.7ms
[2025-11-03T21:57:11.389+0900][info][gc,heap     ] GC(0) Eden regions: 13->0(14)
[2025-11-03T21:57:11.389+0900][info][gc,heap     ] GC(0) Survivor regions: 0->2(2)
[2025-11-03T21:57:11.389+0900][info][gc,heap     ] GC(0) Old regions: 2->4
[2025-11-03T21:57:11.389+0900][info][gc,heap     ] GC(0) Humongous regions: 0->0
[2025-11-03T21:57:11.389+0900][info][gc,metaspace] GC(0) Metaspace: 6598K(6848K)->6598K(6848K) NonClass: 5909K(6016K)->5909K(6016K) Class: 689K(832K)->689K(832K)
[2025-11-03T21:57:11.389+0900][info][gc          ] GC(0) Pause Young (Normal) (G1 Evacuation Pause) 14M->4M(60M) 37.236ms
[2025-11-03T21:57:11.389+0900][info][gc,cpu      ] GC(0) User=0.03s Sys=0.04s Real=0.04s
Database Server Log
In some cases, information recorded in database server logs can help identify the causes of increased CPU usage. As an example, this section explains how to review PostgreSQL logs.
- postgresql*.log
These log files record various internal operations and anomalies that occur within the PostgreSQL database. When CPU usage is high, check whether any related events are being logged here.
For example, one of the most common database performance issues is the occurrence of slow queries. A slow query is a query that takes a long time to execute, and even if it is executed infrequently, it can still affect overall database performance depending on the situation. Using PostgreSQL as an example, the following shows a sample of log output. When a query exceeds a predefined execution time threshold, the execution time and the executed SQL statement are logged as shown below.
[root@quiz ~]# tail /var/lib/pgsql/data/log/postgresql-Fri.log
2025-11-07 10:48:20.143 JST [859967] LOG:  duration: 2024.725 ms  statement: SELECT pg_sleep(2);
[root@quiz ~]#
Note: To detect slow queries, add or modify the following settings in postgresql.conf. In this example, queries that take longer than 1,000 ms (1 second) are logged.
[root@quiz ~]# vi /var/lib/pgsql/data/postgresql.conf
[root@quiz ~]# grep log_min_duration_statement /var/lib/pgsql/data/postgresql.conf
#log_min_duration_statement = -1        # -1 is disabled, 0 logs all statements
log_min_duration_statement = 1000   # Log SQL statements that take longer than 1 second
Note: When analyzing slow queries in Oracle Database, it is common to use AWR (Automatic Workload Repository) reports or ASH (Active Session History). These reports allow you to identify SQL statements with long execution times or high CPU usage.
Temporary Countermeasure for Increased CPU Usage
If high CPU usage persists, it may impact overall system performance, so you should consider taking some form of action. Although the appropriate response depends on the root cause, the following example focuses on temporary countermeasures at the OS layer.
As shown below, let’s walk through a case where a bash process is monopolizing a single CPU core and apply a mitigation accordingly. By the way, after running the top command, you can press “1” to display CPU usage for each individual core.
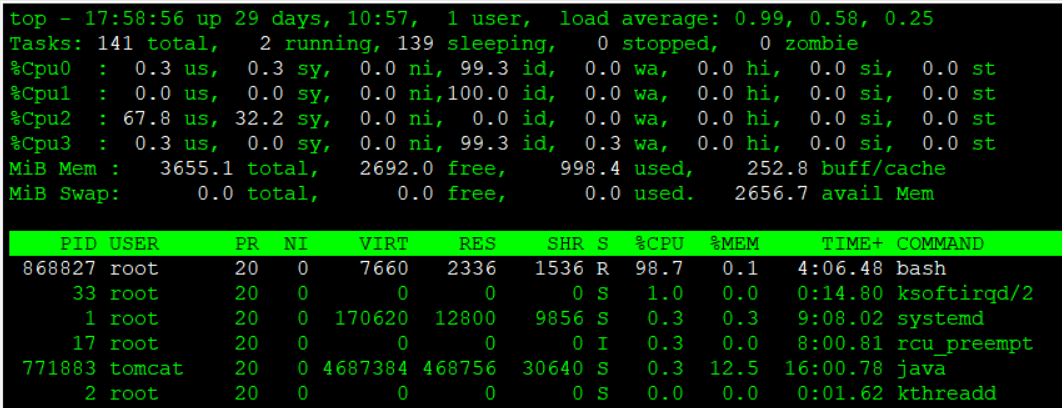
Note: By running the following command, you can easily create a situation where a single CPU core is fully utilized.
[root@quiz ~]# while :; do echo $((22**22)) > /dev/null; done &
[1] 870406
[root@quiz ~]#
Stopping a process
If you have identified the process responsible for the increased CPU usage, stopping that process can be an effective countermeasure. However, before doing so, make sure to carefully verify that stopping it will not impact service availability, and then proceed with the action.
kill command
Let’s try stopping the process using the kill command. Execute the kill command with the target process ID (PID) specified as an argument. As shown below, a message indicating that the process has been terminated will be displayed in standard output.
[root@quiz ~]# kill 868827
[root@quiz ~]#
[1]+  Terminated              while :; do
    echo $((22**22)) > /dev/null;
done
[root@quiz ~]#
There are cases where a process cannot be stopped with the kill command (by default -15, SIGTERM), for example when the process is hung.
In such situations, use the kill command with the -9 option (SIGKILL) to forcefully terminate the process.
[root@quiz ~]# kill -9 868827
[root@quiz ~]#
[1]+  Killed                  while :; do
    echo $((22**22)) > /dev/null;
done
[root@quiz ~]#
systemctl stop command
Although this does not apply to the current example, if the problematic service has been identified and it is safe to stop it, you should stop it using the systemctl stop command rather than the kill command.
Priority Control
If the process causing high CPU usage has been identified but cannot be stopped, one possible approach is to control the CPU scheduling priority of that process so that it does not adversely affect other workloads.
As shown below, you can lower the priority by setting a higher nice value using the “renice” command. However, this will not reduce the CPU usage itself, so you should consider applying a permanent fix as soon as possible.
[root@quiz ~]# renice 10 -p 887442
887442 (process ID) old priority 0, new priority 10
[root@quiz ~]#
[root@quiz ~]# top
top - 11:06:45 up 30 days,  4:05,  1 user,  load average: 0.66, 0.20, 0.07
Tasks: 142 total,   2 running, 140 sleeping,   0 stopped,   0 zombie
%Cpu(s):  0.0 us,  9.4 sy, 17.2 ni, 73.4 id,  0.0 wa,  0.0 hi,  0.0 si,  0.0 st
MiB Mem :   3655.1 total,   2717.3 free,    977.7 used,    243.7 buff/cache
MiB Swap:      0.0 total,      0.0 free,      0.0 used.   2677.4 avail Mem
    PID USER      PR  NI    VIRT    RES    SHR S  %CPU  %MEM     TIME+ COMMAND
 887442 root      30  10    7556   2320   1536 R 100.0   0.1   1:05.95 bash
     27 root      20   0       0      0      0 S   6.2   0.0   0:26.96 ksoftirqd/1
      1 root      20   0  170620  12800   9856 S   0.0   0.3   9:25.39 systemd
      2 root      20   0       0      0      0 S   0.0   0.0   0:01.69 kthreadd
Setting Resource Limits
If a process with high CPU usage has been identified but cannot be stopped, and adjusting its priority still affects other processes, setting an upper limit on CPU usage may be an effective approach.
As shown below, you can use the “cpulimit” command to specify a CPU usage cap for a specific process. In this example, you can confirm that the CPU usage of the bash process is limited to around 50%. However, limiting CPU resources can increase processing time and may impact the service. Therefore, you should promptly consider applying a permanent solution.
[root@quiz ~]# cpulimit -p 887537 -l 50 &
[2] 887664
[root@quiz ~]# Process 887537 found
[root@quiz ~]#
[root@quiz ~]# top
top - 11:18:20 up 30 days,  4:16,  2 users,  load average: 0.73, 0.86, 0.56
Tasks: 148 total,   2 running, 146 sleeping,   0 stopped,   0 zombie
%Cpu(s):  8.6 us,  4.2 sy,  0.0 ni, 87.0 id,  0.0 wa,  0.0 hi,  0.2 si,  0.0 st
MiB Mem :   3655.1 total,   2490.1 free,   1024.5 used,    455.5 buff/cache
MiB Swap:      0.0 total,      0.0 free,      0.0 used.   2630.6 avail Mem
    PID USER      PR  NI    VIRT    RES    SHR S  %CPU  %MEM     TIME+ COMMAND
 887537 root      20   0    7556   2336   1536 R  50.2   0.1   3:59.92 bash
     17 root      20   0       0      0      0 I   0.7   0.0   8:58.15 rcu_preempt
     33 root      20   0       0      0      0 S   0.3   0.0   0:42.48 ksoftirqd/2
    568 root      16  -4   19084   4252   1536 S   0.3   0.1   4:45.13 auditd
 771883 tomcat    20   0 4687384 467480  30640 S   0.3  12.5  18:32.28 java
 887590 root       9 -11    2652   1664   1536 S   0.3   0.0   0:00.14 cpulimit
Expanding CPU Cores
While this may be difficult on physical servers, expanding the number of logical CPU cores is relatively easy on virtual servers. Consider this as one of the possible options.
Permanent Countermeasures for High CPU Usage
Permanent Countermeasures refer to measures that address the root cause of the issue. Examples include the following:
- Fix the application
Correct high-load computational logic or infinite loops, and release an updated version of the application. - Optimize SQL
Review and tune slow queries or queries with high processing overhead. - Enable traffic limiting
Limit the number of requests to mitigate sudden traffic spikes or DDoS attacks. - Tune batch processing
Run batch jobs during periods of lower resource utilization or split batch jobs into smaller units. - CPU Resource Tuning
- Change process priorities (nice / renice)
- Set upper limits on CPU usage (cpulimit / cgroups)
- Review and adjust the hardware configuration, such as adding logical CPU cores
Summary
In this article, I explained the investigation procedures and countermeasures for increased CPU usage on Linux servers. The key points are summarized as follows:
- Understand the Impact of High CPU Load
If a high CPU load continues for an extended period, it can lead to risks such as application latency, abnormal batch job behavior, inability to establish SSH connections, and in the worst case, server outages. Prompt action is therefore essential. - Understand the Root Cause Identification Process
- Use commands such as “top”, “ps”, and “pidstat” to monitor CPU usage at the process and thread levels.
- Check OS logs as well as Web/AP/DB logs to identify when the CPU load occurred and the factors that triggered it.
- Ensure System Stability with Temporary Countermeasures
- Stop unnecessary processes (“kill”, “systemctl stop”).
- Lower process priority to reduce the impact on other processes (“renice”).
- Control the load by setting an upper limit on CPU usage (“cpulimit”).
- In virtualized environments, temporarily increase the number of CPU cores.
- Eliminate the Root Cause with Permanent Solutions
- Optimize applications and SQL.
- Split batch jobs or adjust their execution timing.
- Introduce traffic throttling or DDoS protection.
- Review CPU resource management and hardware configuration.
An increase in CPU usage is not merely a temporary phenomenon; it is an issue that directly affects overall system stability and service quality. By understanding the investigation procedures and mitigation strategies introduced in this article, and by combining temporary and permanent measures, we hope you can achieve more reliable and stable operation of production systems.

コメント