Introduction
Datadog is a highly powerful monitoring service that enables unified visualization of metrics, logs, APM, network monitoring, and more. However, if it is introduced and operated without careful planning, you may find yourself facing situations such as higher-than-expected bills and increased network bandwidth utilization.
One of the major causes of these issues is the volume of data transmitted to Datadog. Datadog’s pricing model heavily depends on how much data you send, meaning that unnecessary data transmission directly leads to higher costs.
In this article, we will explain practical methods to reduce data transfer volume and optimize costs while maintaining full observability in Datadog.
If you have not used Datadog yet, please refer to the following article for an introduction and setup guide: https://eeengineer.com/en/datadog-monitoring-observability-guide/
How to Check Data Transfer Volume
First, before attempting to reduce data transfer volume, you should understand how to check it.
The Datadog Agent runs on servers or containers and sends the following types of data to Datadog’s SaaS platform:
- Metrics (CPU, memory, disk, application-specific custom metrics, etc.)
- APM traces (per-request processing time and service dependencies)
- Logs (application logs, middleware logs)
- Process information and network data (if enabled)
The important point is that costs are affected not by the amount of data stored, but by the amount of data transmitted itself. In other words, as long as unnecessary data continues to be sent, costs will be incurred—even if you are not viewing any dashboards.
You can check data transfer–related metrics under Organization Settings → Plan & Usage, so make sure to review them regularly.
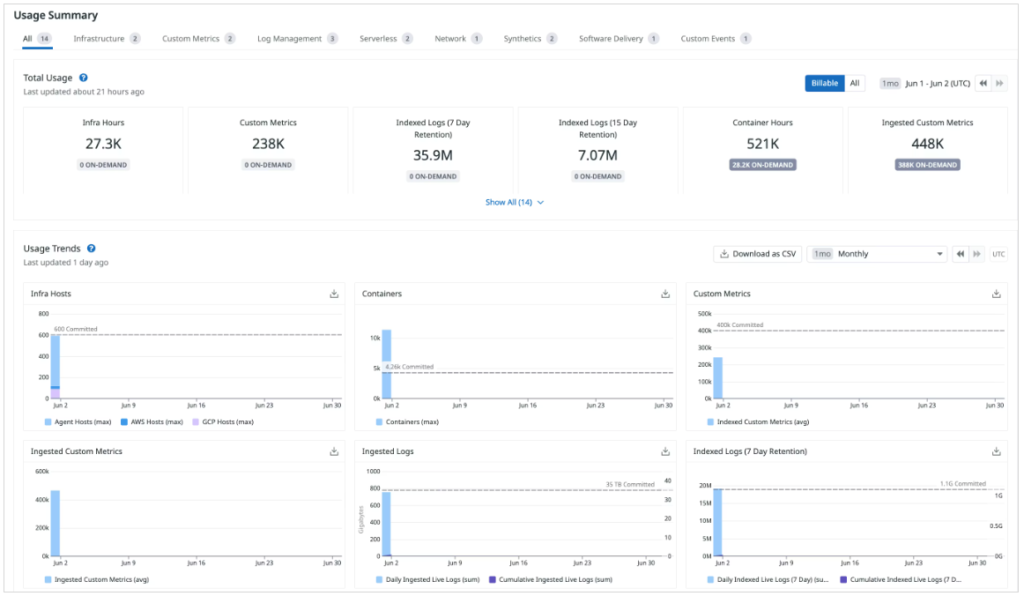
Reference : https://docs.datadoghq.com/account_management/plan_and_usage/usage_details/
How to Reduce Data Transfer Volume
Now, let’s walk through how to reduce data transfer volume for each feature.
How to Reduce Data Transfer Volume in Datadog Infrastructure
You can reduce Infrastructure-related data transfer volume by increasing the Datadog Agent’s check interval. By default, it is set to 15 seconds, and you can extend this interval.
As an example, let’s change it from 15 seconds to 60 seconds. Add the min_collection_interval setting to datadog.yaml as shown below, and then restart the Agent.
[root@quiz ~]# vi /etc/datadog-agent/datadog.yaml
[root@quiz ~]# grep "min_collection_interval: 60" /etc/datadog-agent/datadog.yaml
     min_collection_interval: 60
[root@quiz ~]#
[root@quiz ~]# systemctl restart datadog-agent
[root@quiz ~]#
I could not find a direct way to check the data transfer volume specifically for Infrastructure-related data, but you can verify indirectly that the data transfer has decreased.
By running the datadog-agent status command as shown below, you can check the cumulative number of metric samples. Compare the increase in the cumulative count before and after changing min_collection_interval to confirm that the growth in sample count has decreased.
However, please note that this sample count includes data other than Infrastructure-related metrics. Therefore, the number of samples will not decrease strictly in proportion to the configuration change.
[root@quiz ~]# datadog-agent status
~~Truncated~~
==========
Aggregator
==========
  Checks Metric Sample: 5,615
  Dogstatsd Metric Sample: 489
  Event: 1
  Events Flushed: 1
  Number Of Flushes: 17
  Series Flushed: 4,894
  Service Check: 53
  Service Checks Flushed: 69
How to Reduce APM Data Transfer Volume
APM tends to generate a relatively large volume of data, so proper configuration is important.
You can reduce data transfer volume using the following two methods. We will explain each of them in detail:
– Configuring the sampling rate
– Excluding unnecessary endpoints
Configuring the Sampling Rate
When APM is enabled, information about the flow of request processing—called a “trace”—is sent to Datadog for each application request. Not all requests are ingested without limits; the Datadog Agent controls the number of traces collected per second.
By default, the setting is 10 traces per second per Agent (max_traces_per_second = 10).
If your goal is to understand average response times and general trends, it may not be necessary to ingest a large volume of trace data. In practice, it is common to reduce trace collection for normal traffic while prioritizing the collection of traces when errors occur.
Be sure to configure an appropriate sampling rate based on your use case and traffic volume.
Now, let’s explain how to change the sampling rate.
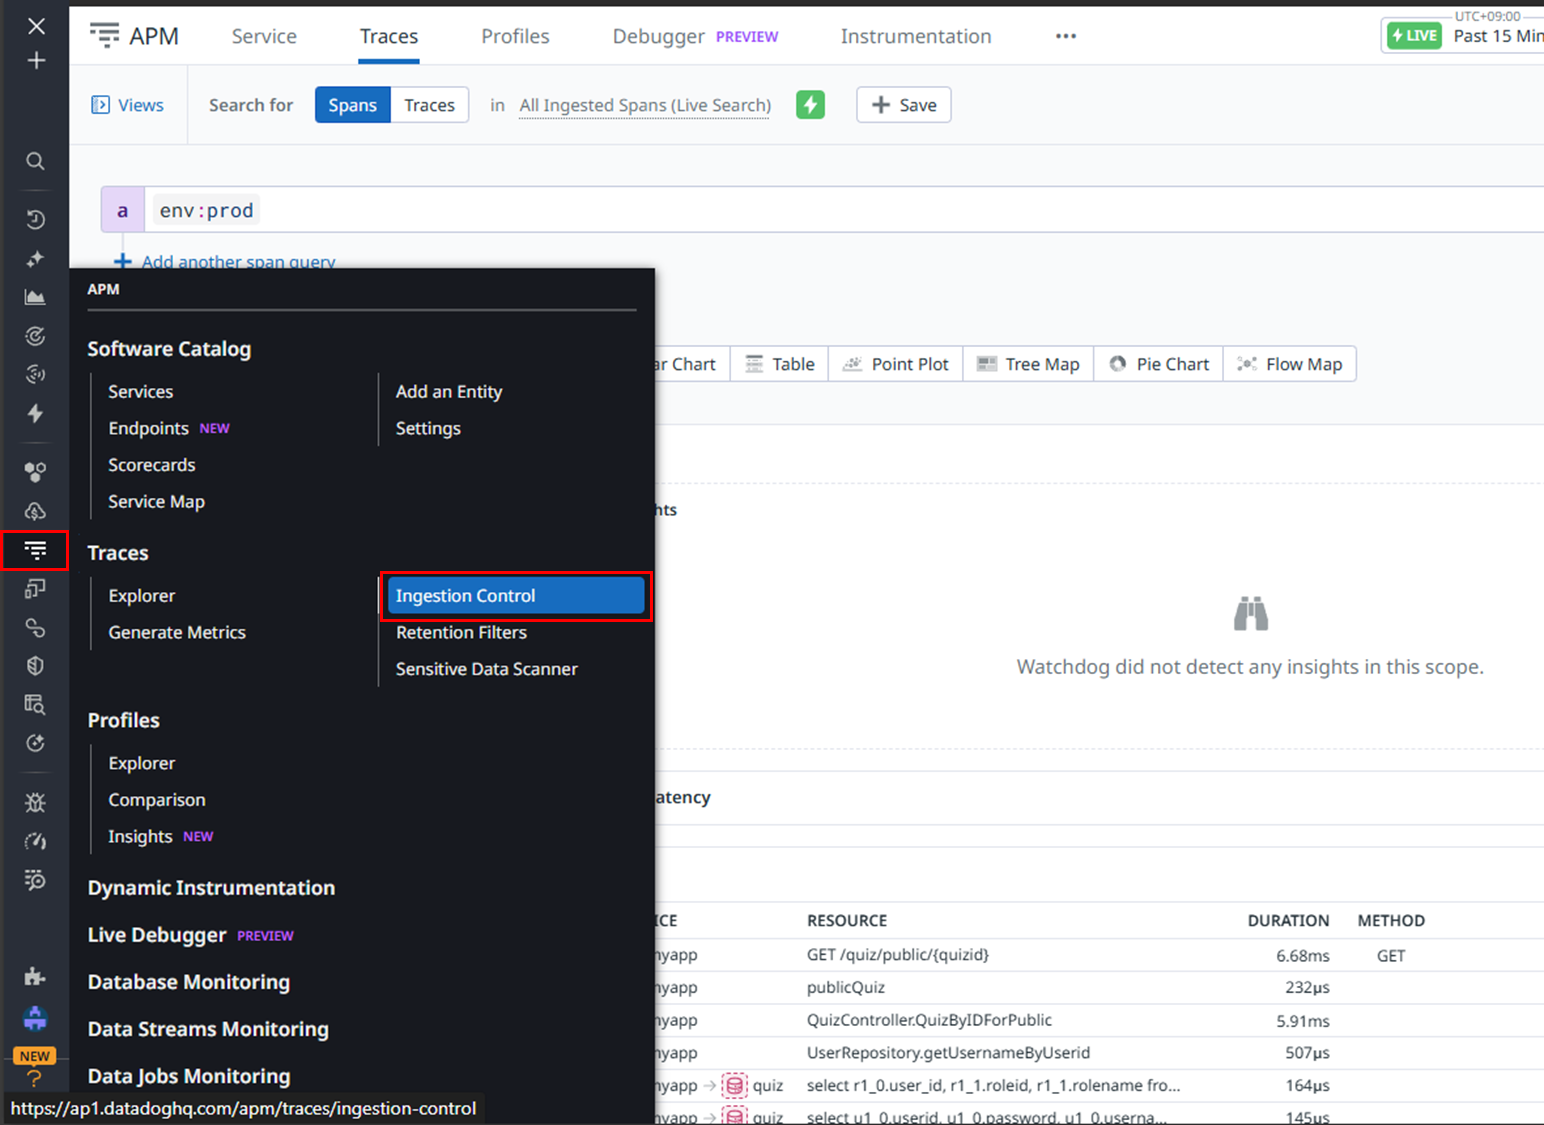
Click APM → Ingestion Control in the Datadog console.
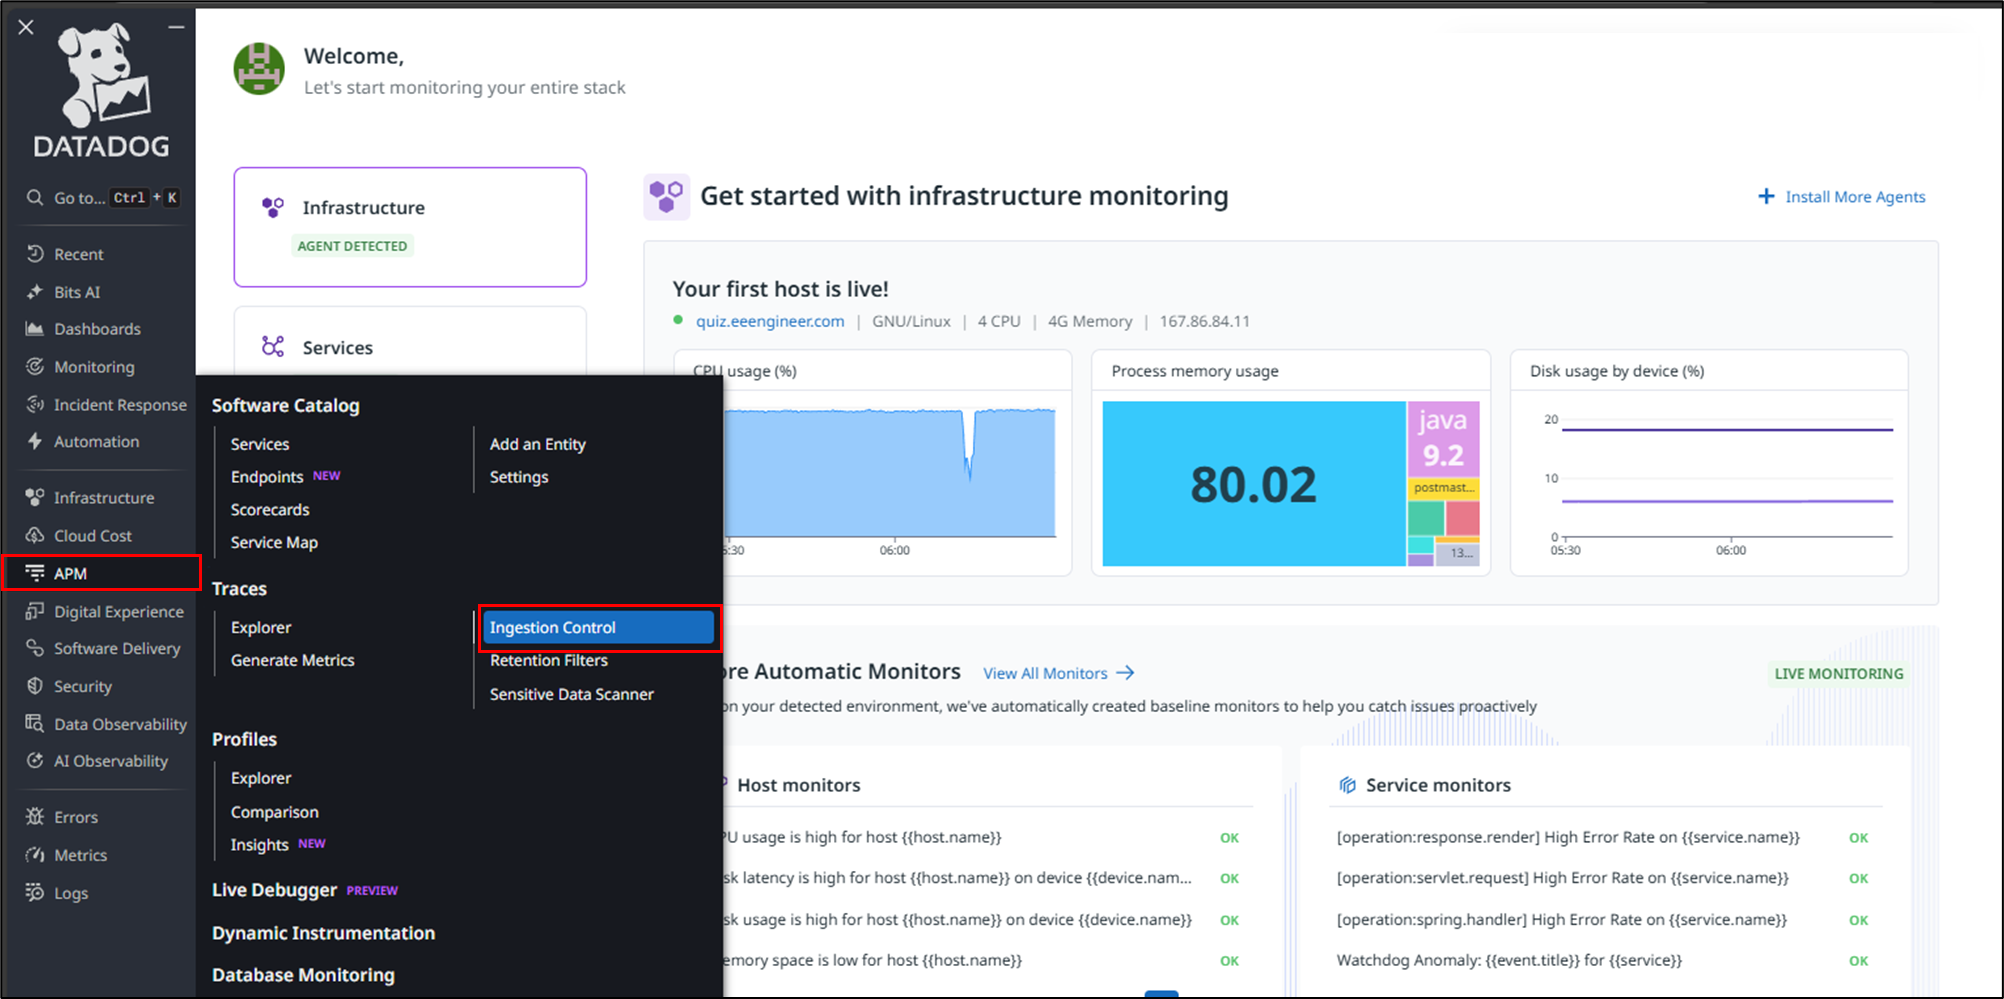
Click Configure Datadog Agent Ingestion.
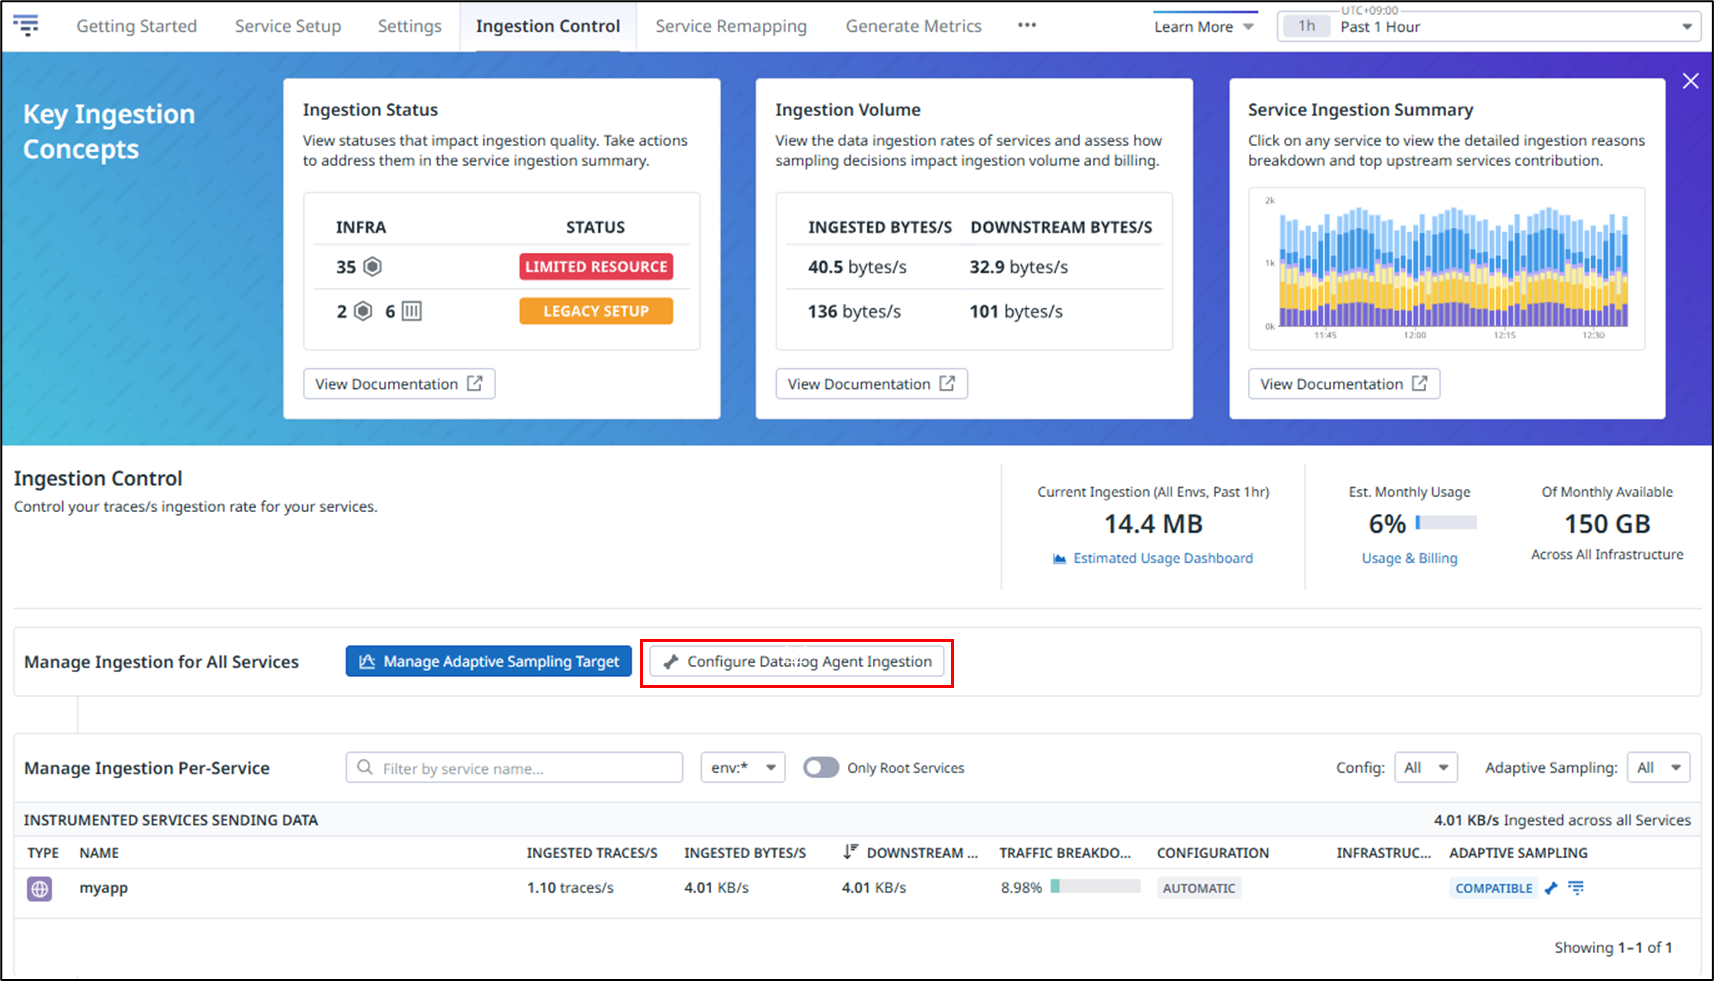
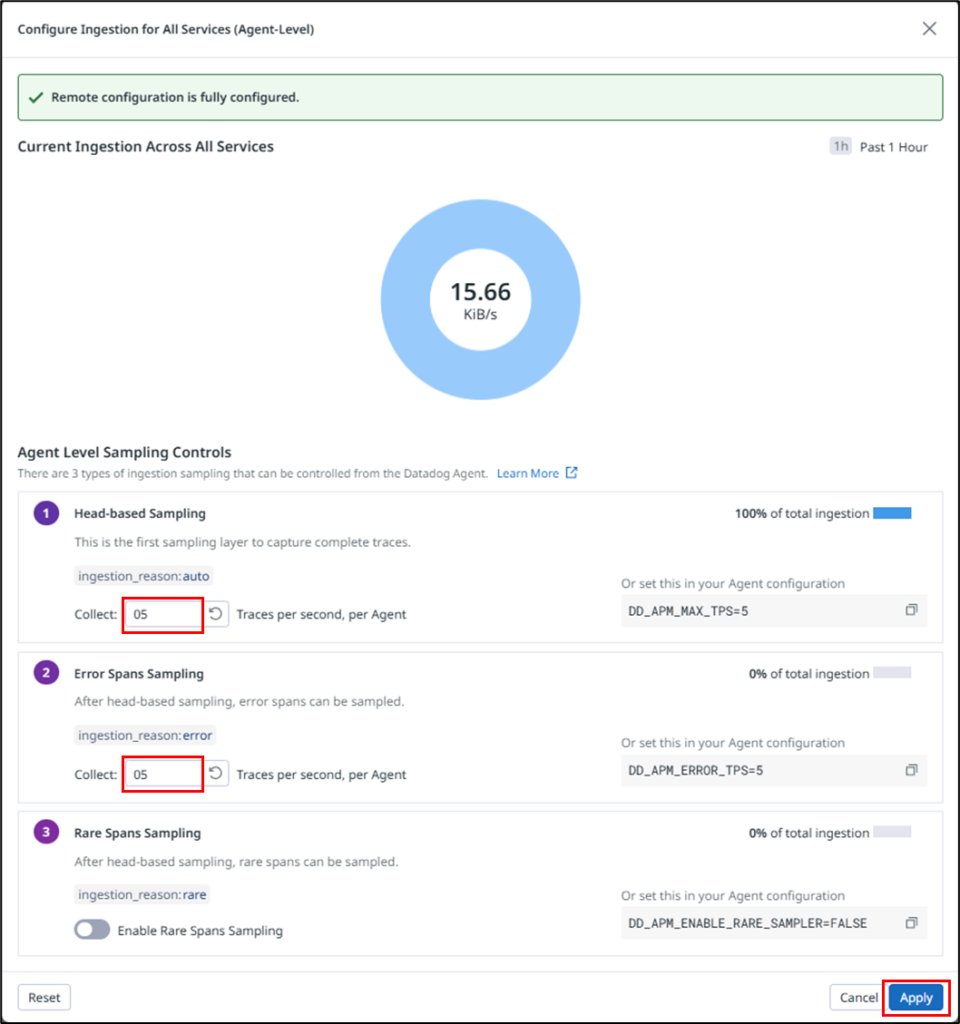
Set the number of traces collected per second.
In this example, the values for Head-based Sampling and Error Spans Sampling are changed from the default value of 10 to 5.
Let me explain each configuration item.
| No. | Setting | Description | Default |
|---|---|---|---|
| 1 | Head-based Sampling | Determines whether to sample a trace at the entry point (head) of each incoming request. | 10 traces/sec (per Agent) |
| 2 | Error Spans Sampling | Prioritizes retaining traces that were not selected by head-based sampling but contain spans with error=1. Increasing this value is useful for troubleshooting and incident analysis. | 10 traces/sec (per Agent) |
| 3 | Rare Spans Sampling | Prioritizes retaining traces that were not selected by head-based sampling but contain rare spans with low-frequency resources or tags. Useful for investigating infrequent issues. | Disabled |
For more details, please refer to the following Datadog website.
https://docs.datadoghq.com/ja/tracing/trace_pipeline/ingestion_mechanisms/?tab=java
Now, let’s verify whether the amount of ingested data has actually been reduced.
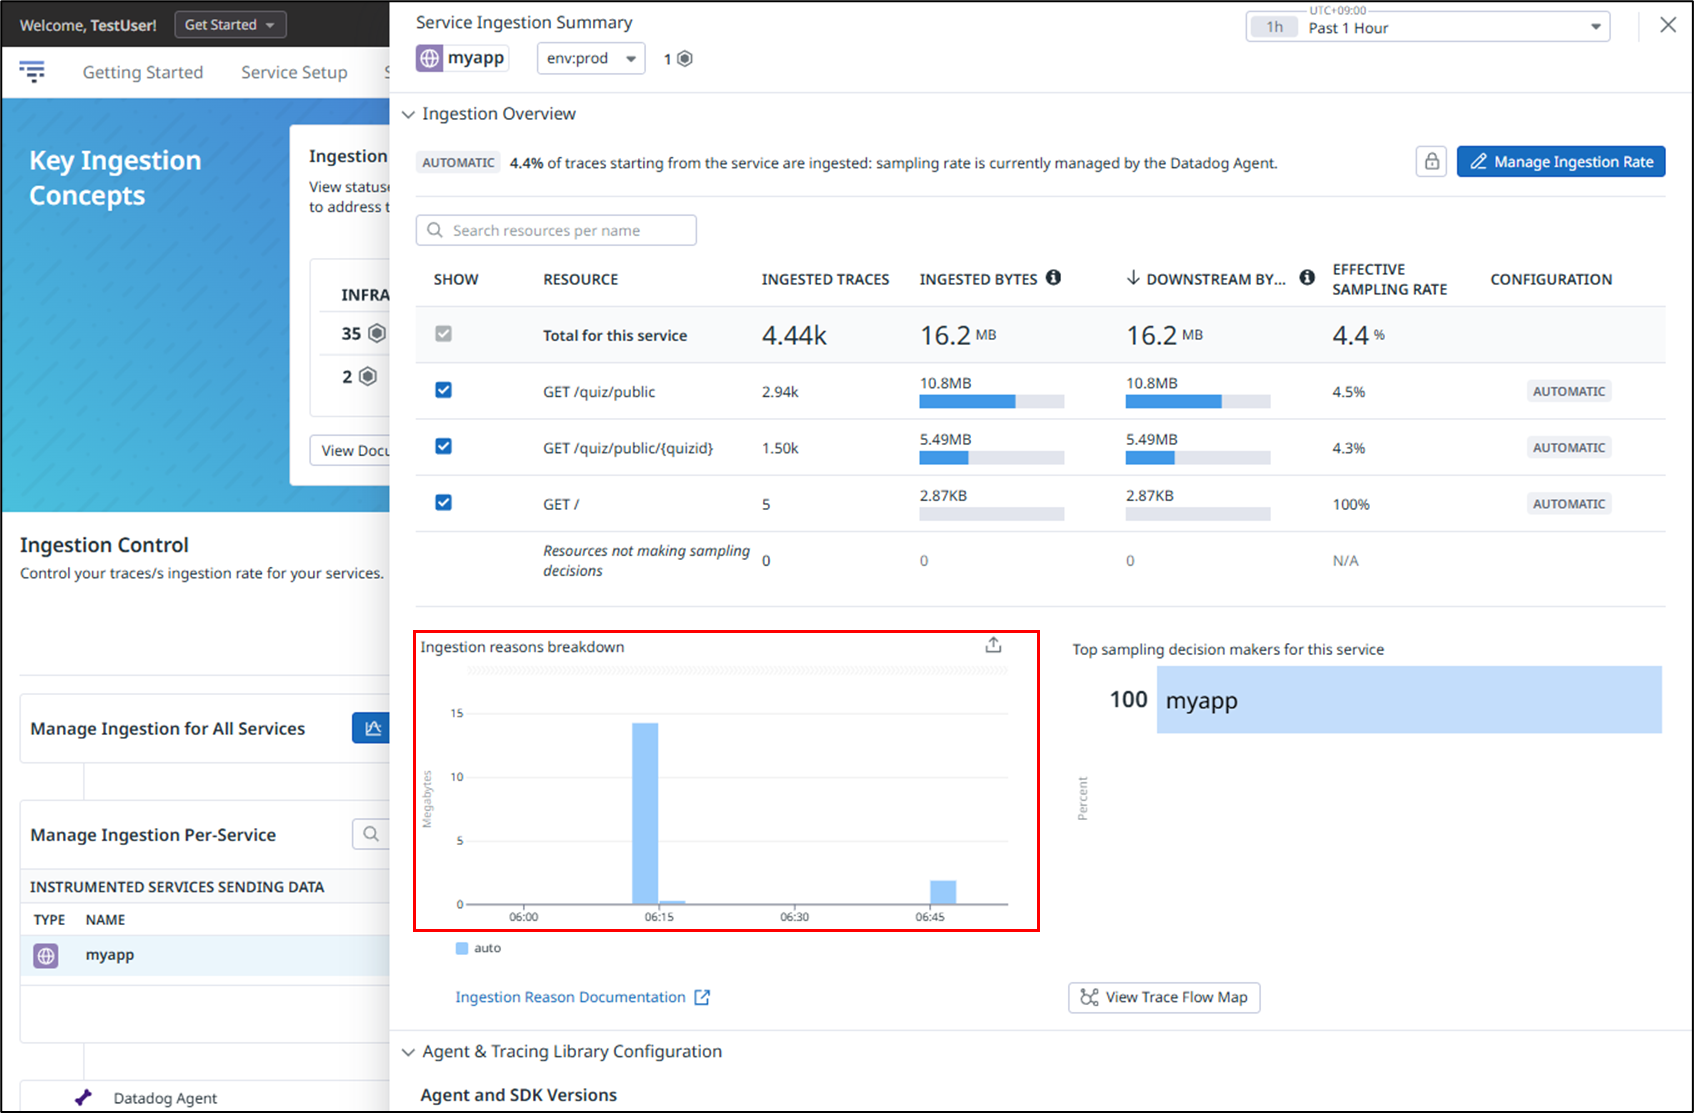
After clicking APM → Ingestion Control, select the application you want to review.
As shown below, you can confirm that the ingested data volume is recorded under Ingestion Reasons Breakdown.
The spike on the left reflects the default values of 10 for both Head-based Sampling and Error Spans Sampling, while the spike on the right shows the result after reducing both values to 5. This demonstrates that lowering the sampling rate effectively reduces the amount of ingested data.
Excluding Unnecessary Endpoints
If health check endpoints or frequently called internal APIs are included in trace collection, the number of ingested traces and spans can increase significantly. Since these endpoints are often of lower importance from an observability perspective, excluding them from tracing can lead to substantial cost savings.
As an example, let’s configure a setting to exclude access to a specific URL from trace collection.
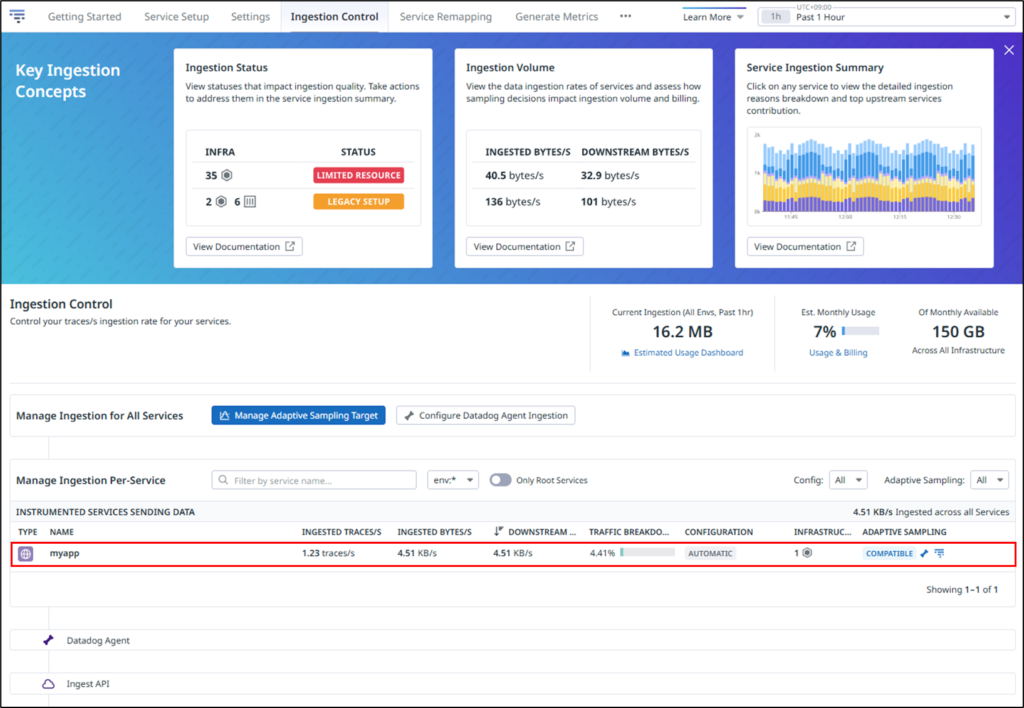
First, check the current volume of data being sent to Datadog. Click Traces → Ingestion Control.
Click the target service.
As shown below, you can check the volume of data being transmitted for each accessed resource.
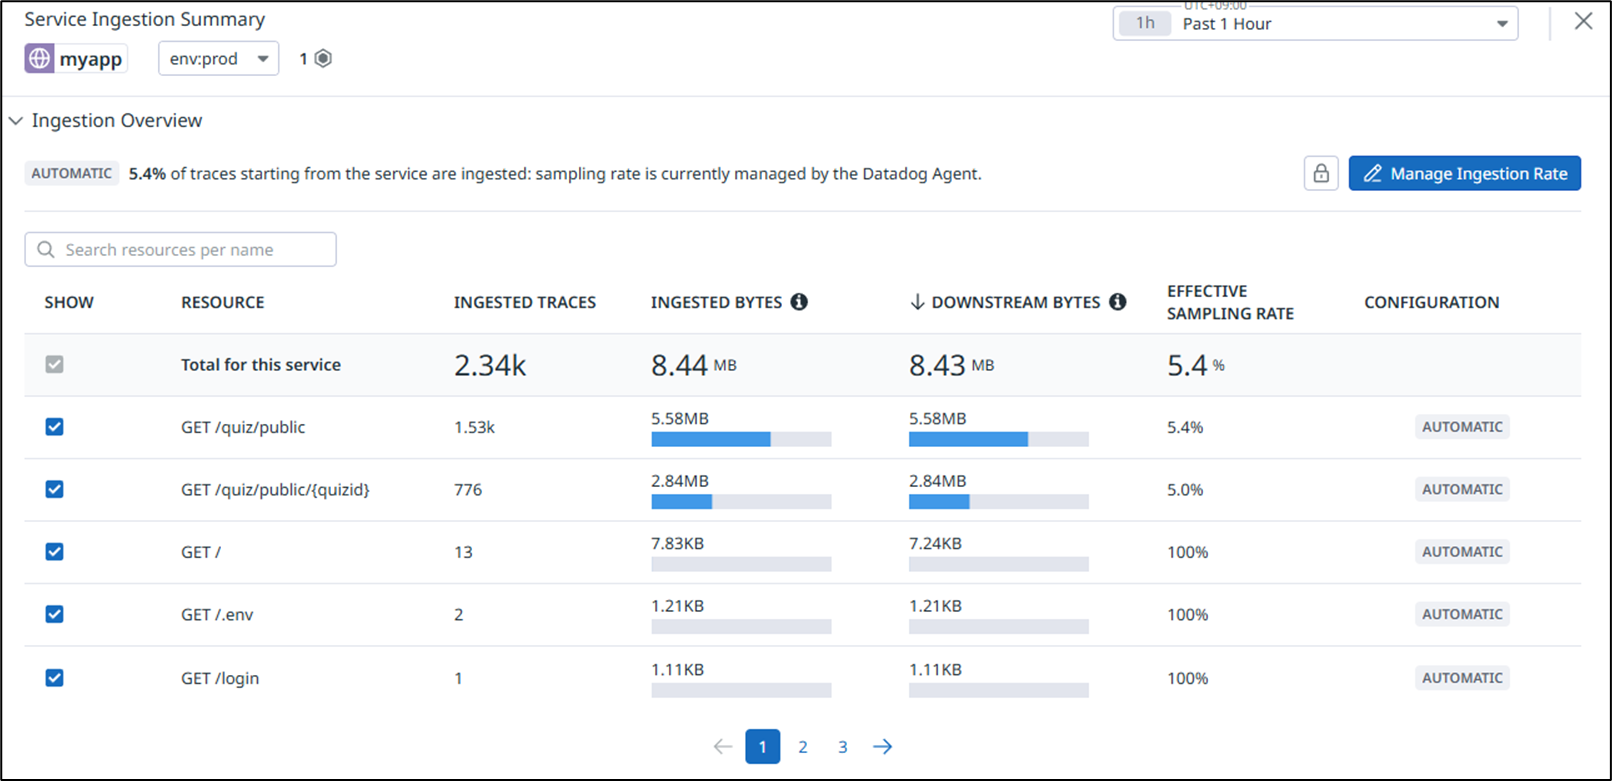
As an example, let’s exclude requests to “GET /quiz/public” from trace collection.
As shown below, modify the datadog.yaml configuration on the monitored server side.
[root@quiz ~]# vi /etc/datadog-agent/datadog.yaml
apm_config:
  filter_tags:
    reject:
      - "http.route:/quiz/public"
[root@quiz ~]# systemctl restart datadog-agent
[root@quiz ~]#
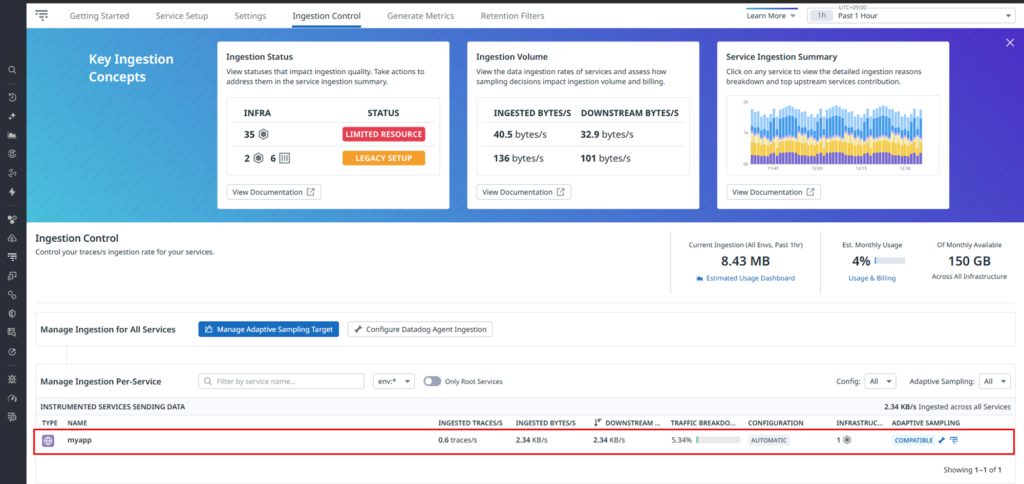
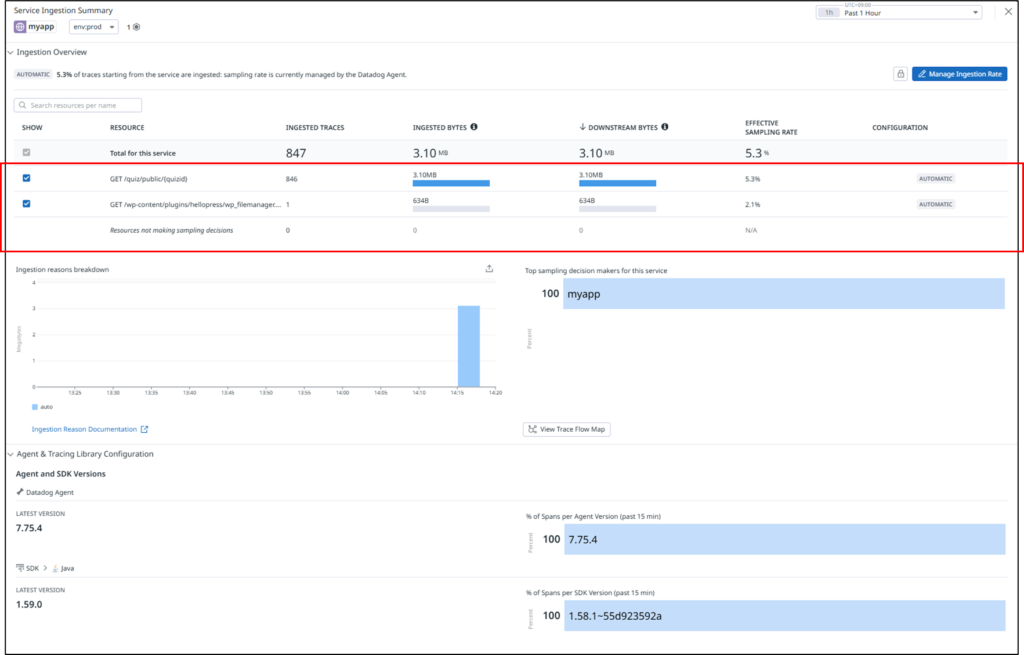
As shown below, you can confirm that data ingestion for GET /quiz/public is no longer occurring.
Avoid High-Cardinality Tags
You also need to be careful when designing tags for APM traces.
If you attach tags whose values change for every request—such as user IDs or request IDs—the data volume and internal processing costs will increase significantly.
It is important to establish clear rules, such as using only static or limited-value tags and avoiding tags with dynamically increasing values.
How to Reduce Log Data Transfer Volume
In Datadog, logs are a data type with particularly high cost impact. If you send all application logs unconditionally, both transfer volume and storage volume can increase rapidly. Therefore, it is recommended to limit log forwarding to only what is truly necessary.
In particular, the following types of logs are likely to cause cost increases:
Large volumes of INFO or DEBUG logs Logs that include detailed context for every request
Filter Logs on the Agent Side
The most effective measure is to filter logs before sending them to Datadog.
For example:
Send only ERROR and WARN level logs Send logs only from specific applications Filter logs by path or message content
By discarding unnecessary logs before transmission, you can reduce both network transfer volume and Datadog billing at the same time.
As an example, let’s apply the following settings to Apache access logs and error logs:
Send only ERROR / WARN logs Exclude a specific URL (e.g., /health)
[root@quiz ~]# cat /etc/datadog-agent/conf.d/apache.d/conf.yaml
init_config:
instances:
  - apache_status_url: https://127.0.0.1/server-status?auto
    disable_ssl_validation: true
#Log section
logs:
  # Access Log
  - type: file
    path: /var/log/httpd/access_log
    source: apache
    service: apache
    sourcecategory: http_web_access
    ## Exclude health check setting
    log_processing_rules:
      - type: exclude_at_match
        name: exclude_healthcheck
        pattern: "/health"
  # Error Log
  - type: file
    path: /var/log/httpd/error_log
    source: apache
    service: apache
    sourcecategory: http_web_error
    ## Send ERROR/WARNING Message Setting
    log_processing_rules:
      - type: include_at_match
        name: only_error_warn
        pattern: "error|warn"
[root@quiz ~]#
Reducing Log Size
When using JSON-formatted logs, the log size per line tends to become large. Reviewing the following points can help reduce data transfer volume:
– Avoid redundantly outputting the same information every time.
– Avoid including unnecessarily large arrays or deeply nested structures.
– Limit the fields to only those that are truly necessary.
Reviewing Metrics and Custom Metrics
Custom Metrics Can Increase Without You Noticing
In Datadog, custom metrics are billable. In some cases, enabling integrations can unintentionally result in a large number of metrics being sent.
It is important to regularly review whether those metrics are actually used in dashboards or alerts, and to ensure that there are no duplicate metrics with the same meaning.
Avoid High-Cardinality Tag Design
As the number of tag combinations attached to metrics increases, the number of billable metrics also increases accordingly.
Dynamic values such as Pod names, container IDs, UUIDs, and session IDs should be excluded from tags whenever possible as part of a careful tag design strategy.
Operational Best Practices for Reducing Costs
It is not enough to review the configuration once and consider the work done; continuous operational management is essential.
Regularly review the Datadog Usage / Billing page. Identify which data types are increasing rapidly. Ensure you can technically explain why the increase occurred. Confirm that development and staging environments are not configured the same as production unless necessary.
By doing so, you can respond early to potential future cost increases.
Summary
Many Datadog cost increases are caused by “large volumes of data being sent without you realizing it.”
The key is not to disable features, but to review the granularity and design of the data being transmitted.
To summarize the key points introduced in this article, they are as follows:
- Set an appropriate collection interval for Infrastructure metrics.
- Adjust the APM sampling rate appropriately.
- Exclude unnecessary endpoints from trace collection.
- Avoid high-cardinality tag design.
- Filter logs before sending them.
- Regularly review increases in custom metrics.
Datadog will function even with a “send everything” approach, but that is not necessarily optimal. To maintain observability while controlling costs, it is important to adopt a design philosophy of handling only the necessary data, at the necessary level of granularity, and for the necessary retention period.
By regularly reviewing configurations—not only in production environments but also in development and staging environments—you can prevent future cost increases.
To make the most of Datadog in the long term, take the time to reassess which data truly delivers value.

コメント