
Introduction
Learn the Essentials of Java Memory Management and Performance Optimization. Understanding Java’s memory management is crucial for preventing performance issues, which can be complex and time-consuming to fix. This article covers the inner workings of the JVM, memory allocation, and garbage collection (GC), providing practical insights to optimize your Java applications.
What is the JVM? Understanding the Java Virtual Machine
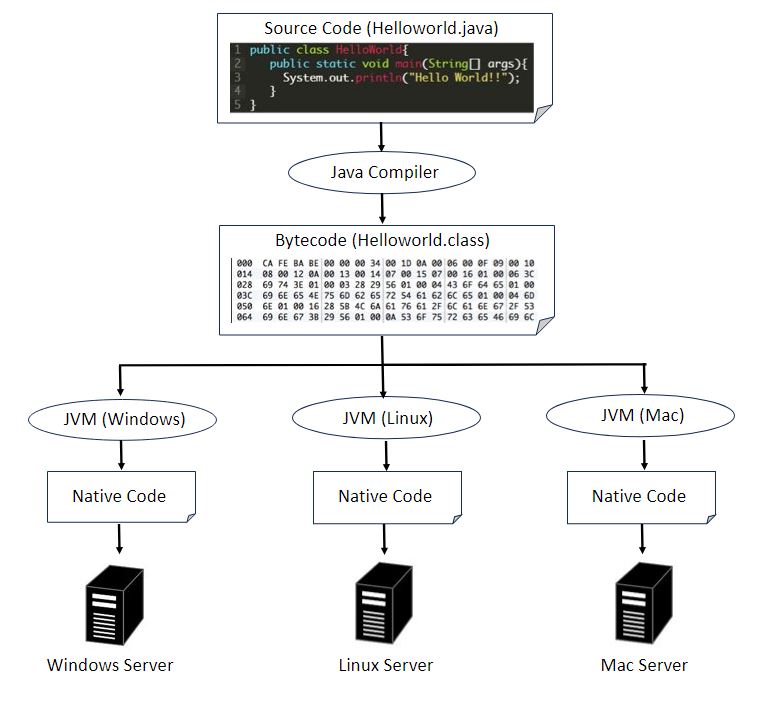
The JVM, or Java Virtual Machine, is essential software for running Java programs. One of Java’s key features is its function to run programs independently of the operating system. To achieve this, Java distributes programs in the form of Java bytecode, which is OS-independent. However, Java bytecode cannot be executed directly on an OS. This is where the JVM comes in: installed on each OS, the JVM converts Java bytecode into native code suitable for the execution environment, allowing Java programs to run seamlessly across different operating systems.
Java (JVM) Memory Space Explained: How the JVM Uses Memory
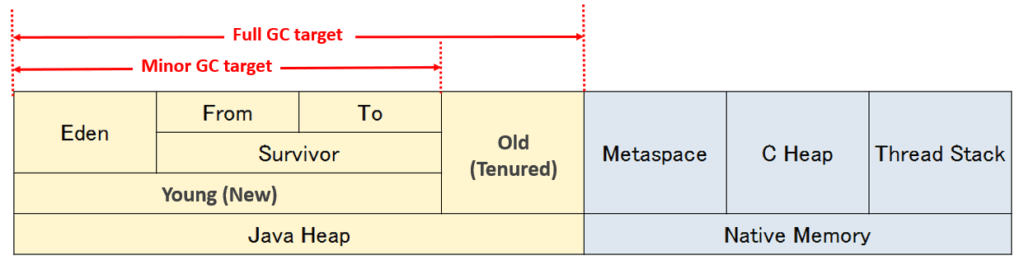
The JVM’s memory is divided into several distinct areas. Understanding this breakdown is essential for learning how garbage collection (GC) works and for effectively tuning JVM performance. Be sure to review this information to optimize your Java applications.

| Item | Explain |
|---|---|
| Java Heap | – The area where Java objects are stored, managed by garbage collection (GC). – Divided into the Young (New) generation and the Old (Tenured) generation. – The management method varies depending on the GC algorithm used. |
| Young(New) | – Stores short-lived objects. – Divided into the Eden and Survivor spaces. – When Eden becomes full, a Minor GC (called Young GC in G1 GC) occurs, and surviving objects are moved to the Survivor space. |
| Eden | – The area where new Java objects are initially allocated. |
| Survivor (From/To) | – The memory area where objects are moved from the Eden space during a Minor GC. – A memory area whose role alternates with each GC cycle. – Temporarily holds surviving objects. |
| Old(Tenured) | – Stores long-lived objects. – Objects that survive a certain number of times in the Young generation are promoted to this space. – In G1 GC, it is called the Old Generation and is managed in units of Regions. |
| Native Memory | – Memory used by the JVM for internal processing. |
| Metaspace | – Stores loaded classes and methods. – Allocated on Native Memory and dynamically expandable. – In versions prior to Java 8, this area was called the Permanent Generation (PermGen). |
| C Heap | – The memory area used by the JVM itself. |
| Thread Stack | – The memory area allocated by the OS to each thread – Manages method calls and local variables |
Regarding the Java Heap, some readers may wonder why memory is divided into so many regions. The main reason is to improve the efficiency of garbage collection (GC). If every GC cycle had to scan all memory regions, CPU usage would increase and application pause times would become longer. By dividing the heap into the New and Old generations, GC can focus on a smaller set of objects and run more efficiently. Additionally, subdividing the New generation into Eden and Survivor spaces makes it easier to distinguish short-lived objects from long-lived ones, allowing for more effective memory management. Reading the next section on Garbage Collection will help you better visualize how these mechanisms work, so be sure to check it out.
Garbage Collection (GC)
Now that we have an overview of the memory areas used by the JVM, let’s deepen our understanding of garbage collection (GC). GC is one of the factors that significantly affects Java performance.
In Java, GC is the mechanism that automatically frees memory used by Java objects. Unlike in C or C++, there is no need to explicitly release memory in your program code.
There are mainly two types of GC:
- Minor GC (Scavenge GC): Frees memory in the New generation. It usually completes within a few milliseconds to tens of milliseconds. Therefore, even if it occurs every 10 seconds or so, it has minimal impact on the application.
- Full GC: Frees memory in both the New and Old generations. This process can take several seconds and triggers Stop the World (a phenomenon where all application threads are paused), which can affect application performance.
Therefore, it is important to properly tune the size of the memory areas used by the JVM to control the frequency of Full GC. For mission-critical systems, it is recommended to limit Full GC occurrences to about 5–10 times per hour at most.
Minor GC (Scavenge GC)
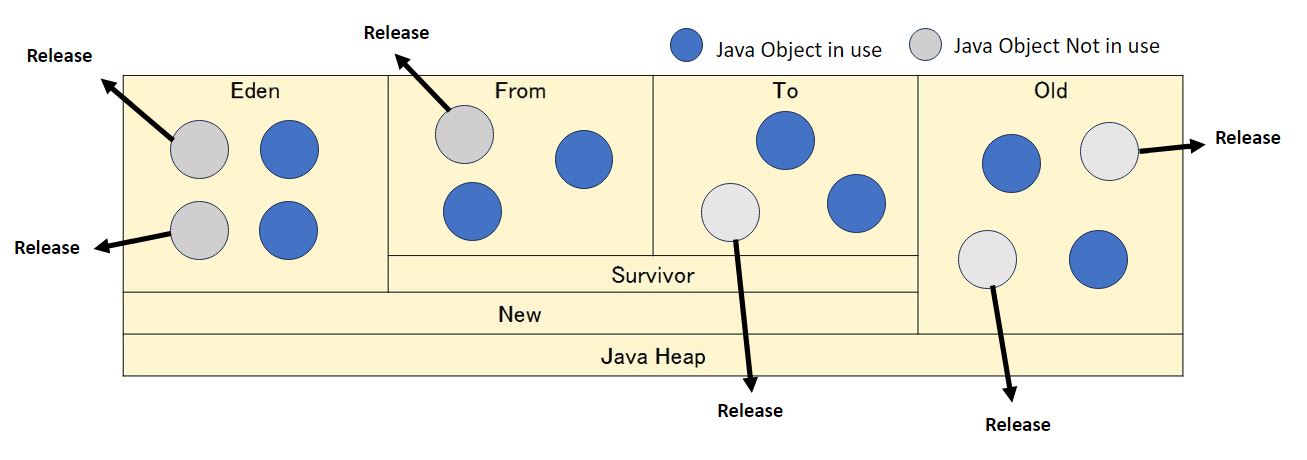
The target of Minor GC is the Java objects in the New generation. Minor GC is triggered when the Eden space becomes full. The process works as follows:
1. Disposing of unnecessary objects
- Unused objects in the Eden and Survivor spaces are freed.
2. Moving objects
- Surviving objects are first moved from the Eden space to the Survivor space (To space).
- Objects in the Survivor space may be moved between the From space and To space as needed.
- Long-lived objects are eventually promoted to the Old generation.
Minor GC usually completes within a few milliseconds to tens of milliseconds, so even if it occurs frequently, it has minimal impact on application performance.

When the Eden space becomes full, Minor GC is also triggered. The process works as follows:
1. Releasing unnecessary objects
- Memory used by unused Java objects in the Eden space is freed.
2. Moving objects
- Surviving objects are moved from the Eden space to the From space (in the previous Minor GC, they were moved to the To space).
- Objects that were already in the To space are handled as follows: unused objects are freed, while still active objects are moved from the To space to the From space.
In this way, Minor GC efficiently manages memory by swapping objects between the Eden and Survivor (From/To) spaces.

After that, Minor GC is triggered each time the Eden space becomes full. During this process, unused objects are freed, and objects are repeatedly moved between the From and To spaces in the Survivor area.
If the number of times a surviving object has been moved exceeds the MaxTenuringThreshold (the maximum number of GC cycles an object can remain in the New generation), the object is promoted from the New generation to the Old generation.
Setting this threshold too low increases the number of objects promoted to the Old generation, which in turn raises the frequency of Full GC. Therefore, it is important to tune this value appropriately to reduce the impact of Full GC on application performance.

Full GC
Full GC targets not only the New region but also the Old and Metaspace regions. While Full GC can occur at various timings, it is generally understood to be triggered when objects are promoted to the Old region and its space becomes exhausted.
To reduce the frequency of Full GC, it is important not only to properly tune the sizes of various Java memory regions but also to design the application so that unnecessary objects are not retained for long periods.
Conclusion
This concludes the article. Here is a summary of the key points covered:
- Java runs on software called the JVM, which allows it to operate on different operating systems.
- The memory used by Java can be broadly divided into two types: the Java heap and native memory.
- Java objects are managed within the various regions of the Java heap.
- Unused Java objects are released from memory when garbage collection (GC) occurs.
- There are two types of GC: Scavenge GC and Full GC. To avoid performance impact, the number of Full GC events should be minimized.


コメント