
Introduction
Sudden spikes in memory usage on Linux servers in production environments are by no means rare. When memory usage becomes high, it can lead to swap activity, I/O latency, degraded application responsiveness, and in the worst case, service outages.
However, even after detecting an increase in memory usage, it is often not easy to quickly determine which process or thread is consuming excessive memory, whether the root cause lies in the application or in the OS/middleware, what immediate mitigation measures can be taken, and how to proceed with identifying the fundamental cause.
In this article, I wrote about practical and effective troubleshooting approaches for situations where memory usage is high—methods that are proven to be useful in commercial production systems.
Impact of High Memory Usage
As memory usage increases, the following issues may arise.
- Memory exhaustion triggers swapping, causing higher I/O wait and degraded application responsiveness.
- Prolonged operation in this state may eventually result in service downtime.
- Batch jobs and time-consuming processes may be delayed or may time out.
- Risk of OOM (Out of Memory) Killer activation, system reboot, or crashes
- SSH connections or management consoles become slow or unresponsive.
Memory usage should not be assessed solely by a high percentage value; trends such as rapidly shrinking free memory, increasing swap usage, and abnormally large buffer/cache usage are also critical.
Investigation Steps When Memory Usage Is High
When memory usage or swap usage exceeds predefined thresholds in monitoring tools, investigate the issue using the following steps. Each step is explained below.
- Collect Overview Information on Memory Usage
- Identify Processes Causing High Memory Usage
- Check System and Application Logs
- Analyze Memory Dumps
Collect Overview Information on Memory Usage
First, obtain an overview of the system’s memory usage by running various commands on the Linux server.
free command
The free command allows you to quickly check the system’s actual memory usage.
[root@quiz ~]# free
               total        used        free      shared  buff/cache   available
Mem:         3742864     1258272     2516480       93872      269220     2484592
Swap:              0           0           0
[root@quiz ~]#- total
The total amount of physical memory. This corresponds to the MemTotal value in /proc/meminfo. - used
The amount of memory currently in use, including cache. Because it includes reclaimable cache memory, this field is not suitable for accurately assessing actual memory usage. - free
Completely unused memory. - shared
Memory shared among multiple processes - buff/cache
The total amount of reusable buffer cache and page cache. This memory can be reclaimed when needed. - available
The total amount of memory that is readily available for use. This is the most important field, so check this value first.
As shown below, you can check the actual memory usage.
Actual Memory Usage(%) = ( total – available ) / total × 100
= ( 3742864 – 2484592 ) / 3742864 × 100
≒ 33.6 %
Check meminfo
To obtain the most accurate information about memory usage, it is best to review the contents of the meminfo file. As shown below, it provides detailed information about various memory-related resources compared to the free command.
[root@quiz ~]# cat /proc/meminfo
MemTotal:        3742864 kB
MemFree:         1599236 kB
MemAvailable:    2420176 kB
Buffers:           14228 kB
Cached:          1111208 kB
SwapCached:            0 kB
Active:          1030672 kB
Inactive:         925768 kB
Active(anon):     924940 kB
Inactive(anon):       52 kB
Active(file):     105732 kB
Inactive(file):   925716 kB
Unevictable:          16 kB
Mlocked:              16 kB
SwapTotal:             0 kB
SwapFree:              0 kB
Zswap:                 0 kB
Zswapped:              0 kB
~~Truncated~~
[root@quiz ~]#
top command
Running the top command also allows you to obtain an overview of memory usage.
- MiB Mem:
- total: Total physical memory
- free: Completely unused free memory
- used: Memory in use (excluding free and buff/cache)
- buff/cache: Memory used by the OS for caches and buffers (can be reclaimed when needed)
- MiB Swap:
- total:Total swap space
- free: Available swap space
- used: Used swap space
- avail mem: Memory actually available for applications
vmstat command
By running the vmstat command, you can check whether swap-in and swap-out activity is occurring.
[root@quiz ~]# vmstat
procs -----------memory---------- ---swap-- -----io---- -system-- ------cpu-----
 r  b   swpd   free   buff  cache   si   so    bi    bo   in   cs us sy id wa st
 0  0      0 2416156   6696 276192    0    0     7     6    1    4  1  0 99  0  0
[root@quiz ~]#- si: Swap-in (swap → RAM) per second
- so: Swap-out (RAM → swap) per second
Identifying the cause of increased memory usage
If high memory usage persists, identify the root cause. Checking memory usage on a per-process basis is an effective approach.
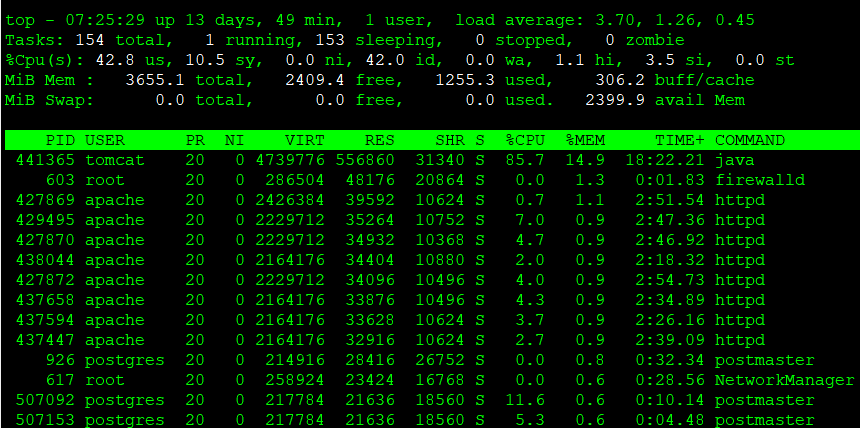
top command
After running the top command, press M to sort processes by memory usage.
If a process is consuming more memory than usual, further analyze its state.
In the top command, %MEM represents the following value:
%MEM = RES / Total Physical Memory ×100
Reference: Ubuntu Manpage: top – display Linux processes
ps command
Although the information obtained is mostly the same as with the top command, you can also retrieve memory-related details using the ps command. By adding the –sort=-%mem option, you can identify processes that are consuming a large amount of memory.
[root@quiz ~]# ps aux --sort=-%mem
USER         PID %CPU %MEM    VSZ   RSS TTY      STAT START   TIME COMMAND
tomcat    441365  2.8 15.9 4725384 598056 ?      Sl   Dec07 200:50 /opt/java/jdk-21.0.2/bin/java -Djava.util.logging.config.file=/opt/tomcat/conf/logging.properties -D
root         603  0.0  1.2 286504 48176 ?        Ssl  Nov26   0:01 /usr/bin/python3 -s /usr/sbin/firewalld --nofork --nopid
apache    427869  0.1  1.1 2426384 42236 ?       Sl   Dec06  10:54 /usr/sbin/httpd -DFOREGROUND
apache    427870  0.1  1.0 2229712 37876 ?       Sl   Dec06  10:39 /usr/sbin/httpd -DFOREGROUND
apache    429495  0.1  1.0 2229712 37824 ?       Sl   Dec07  10:45 /usr/sbin/httpd -DFOREGROUND
apache    437594  0.1  1.0 2164176 37596 ?       Sl   Dec07  10:40 /usr/sbin/httpd -DFOREGROUND
apache    427872  0.1  1.0 2229712 37552 ?       Sl   Dec06  10:40 /usr/sbin/httpd -DFOREGROUND
apache    438044  0.1  1.0 2164176 37476 ?       Sl   Dec07  10:01 /usr/sbin/httpd -DFOREGROUND
apache    437658  0.1  0.9 2164176 37204 ?       Sl   Dec07  10:55 /usr/sbin/httpd -DFOREGROUND
apache    437447  0.1  0.9 2164176 35476 ?       Sl   Dec07  10:34 /usr/sbin/httpd -DFOREGROUND
apache    509665  0.1  0.8 2164176 30752 ?       Sl   Dec09   6:15 /usr/sbin/httpd -DFOREGROUND
postgres     926  0.0  0.7 214916 28416 ?        Ss   Nov26   0:46 /usr/bin/postmaster -D /var/lib/pgsql/data
root         617  0.0  0.6 258924 23424 ?        Ssl  Nov26   0:34 /usr/sbin/NetworkManager --no-daemon
root      100329  0.1  0.5 336892 19008 ?        Sl   Nov26  24:40 fluent-bit -c /etc/fluent-bit/fluent-bit.conf -vv
root         921  0.0  0.4 312188 18128 ?        Ssl  Nov26   6:30 /usr/sbin/rsyslogd -n
root         643  0.0  0.4  23432 15628 ?        Ss   Nov26   1:50 /usr/sbin/httpd -DFOREGROUND
root           1  0.0  0.3 171704 14208 ?        Ss   Nov26   6:37 /usr/lib/systemd/systemd --switched-root --system --deserialize 31
pmap
By executing the pmap command, you can see what kind of memory is allocated to each address.
Use this command when identifying memory area with high usage or area that may be leaking memory.
[root@quiz ~]# pmap -x 441365 | sort -k3 -nr
total kB         4725388  597448  566076
00000000c6e00000  167936  167936  167936 rw---   [ anon ]
00007f4627eff000   45168   44092   44092 rw---   [ anon ]
00007f4594000000   35500   35496   35496 rw---   [ anon ]
00007f4584000000   28384   28384   28384 rw---   [ anon ]
00007f4610a00000   23488   23488   23488 rwx--   [ anon ]
00007f46184c8000   21952   21924   21924 rwx--   [ anon ]
00007f45b19f0000   21504   21504   21504 rw---   [ anon ]
00007f4588000000   17652   17648   17648 rw---   [ anon ]
00007f462de00000   19528   15744       0 r-x-- libjvm.so
00007f45b09f0000   15360   15360   15360 rw---   [ anon ]
00007f45a8000000   14172   13140   13140 rw---   [ anon ]
00007f45b3000000   12952   12932   10788 rw--- classes.jsa
00007f4550000000   12532   12532   12532 rw---   [ anon ]
00007f45f4000000   11836   11836   11836 rw---   [ anon ]
The following information is displayed in the sixth column.
- anon:Memory dynamically allocated by the process (e.g., via malloc or new)
- [heap]:Heap area allocated by the program during execution
- [stack]:Stack area used to store function calls and local variables
- xx.so:Memory regions used by shared libraries
smem
By executing the smem command, you can check the accurate allocation of shared memory for each process.
Since the RSS values shown by ps or top do not indicate how much memory is shared, use this command when you need to understand the exact memory usage.
[root@quiz ~]# smem -r | sort -k4 -nr
  PID User     Command                         Swap      USS      PSS      RSS
99936 root     -bash                              0      928     1418     4496
99935 root     su -                               0     1156     1471     6628
99933 root     sudo su -                          0     1432     2225     8648
  926 postgres /usr/bin/postmaster -D /var        0     8588    12006    29272
  921 root     /usr/sbin/rsyslogd -n              0    13528    14988    19688
  917 root     /sbin/agetty -o -p -- \u --        0      180      217     1856
  662 root     /usr/sbin/crond -n                 0      936     1005     3628
  647 root     sshd: /usr/sbin/sshd -D [li        0     1316     1811     9268
  643 root     /usr/sbin/httpd -DFOREGROUN        0      968     2048    15776
626792 root     sort -k4 -nr                       0      620      709     3392
626791 root     /usr/bin/python3 /usr/bin/s        0    10060    11650    15424
620337 root     sshd: [accepted]                   0     1288     1819     9312
  617 root     /usr/sbin/NetworkManager --        0    11184    13726    23972
  611 chrony   /usr/sbin/chronyd -F 2             0     1220     1440     4160
611991 postgres postgres: postgres quiz 127        0     1700     3236    21920
611791 postgres postgres: postgres quiz 127        0     1700     3236    21920
611784 postgres postgres: postgres quiz 127        0     1688     3224    21908
611737 postgres postgres: postgres quiz 127        0     1688     3224    21908
611725 postgres postgres: postgres quiz 127        0     1688     3224    21908
611714 postgres postgres: postgres quiz 127        0     1684     3220    21904
- USS(Unique Set Size): Memory exclusively used by the process
- PSS(Proportional Set Size):
The amount of memory obtained by proportionally dividing shared memory among processes, representing the actual memory usage. - RSS(Resident Set Size)
: Physical memory usage, the same metric reported by ps and top
slabtop
By running the slabtop command, you can obtain information about memory caches inside the Linux kernel.
If no issues are found on the application side, try investigating the Linux kernel layer.
[root@quiz ~]# slabtop -o -s c
 Active / Total Objects (% used)    : 255087 / 274077 (93.1%)
 Active / Total Slabs (% used)      : 7926 / 7926 (100.0%)
 Active / Total Caches (% used)     : 159 / 232 (68.5%)
 Active / Total Size (% used)       : 57275.80K / 61190.98K (93.6%)
 Minimum / Average / Maximum Object : 0.01K / 0.22K / 8.00K
  OBJS ACTIVE  USE OBJ SIZE  SLABS OBJ/SLAB CACHE SIZE NAME
 13704  13087  95%    0.66K    571       24      9136K inode_cache
   804    798  99%    7.19K    201        4      6432K task_struct
 18846  18553  98%    0.21K   1047       18      4188K vm_area_struct
 19110  17066  89%    0.19K    910       21      3640K dentry
 22240  22174  99%    0.12K    695       32      2780K kernfs_node_cache
  2640   2323  87%    1.00K    165       16      2640K kmalloc-1k
  2002   2002 100%    1.19K     77       26      2464K ext4_inode_cache
  3668   3195  87%    0.57K    131       28      2096K radix_tree_node
   424    412  97%    4.00K     53        8      1696K kmalloc-4k
 15873  15873 100%    0.10K    407       39      1628K buffer_head
  7245   6846  94%    0.19K    345       21      1380K kmalloc-192
  2368   1632  68%    0.50K    148       16      1184K kmalloc-512
   576    549  95%    2.00K     36       16      1152K kmalloc-2k
   352    305  86%    2.69K     32       11      1024K TCPv6
   348    330  94%    2.50K     29       12       928K TCP
  1045   1001  95%    0.80K     55       19       880K shmem_inode_cache
   935    817  87%    0.94K     55       17       880K sock_inode_cache
 19380  18702  96%    0.04K    190      102       760K vma_lock
 23680  16940  71%    0.03K    185      128       740K lsm_inode_cache
    92     73  79%    8.00K     23        4       736K kmalloc-8k
 11584  11354  98%    0.06K    181       64       724K anon_vma_chain
  6786   6636  97%    0.10K    174       39       696K anon_vma
Checking Various Logs
After understanding resource utilization with various commands, check the relevant logs to identify the underlying cause.
OS Logs
Check the logs generated by the Linux OS.
The following are examples of logs typically recorded on RHEL-based operating systems when memory-related problems arise
- /var/log/messages
This file contains general OS logs. For example, logs such as the following are recorded.
When the OOM killer is triggered, a message is sent to syslog. You can identify which process was killed.
kernel: Out of memory: Kill process 1234 (java) score 987 or sacrifice child
kernel: Killed process 1234 (java) total-vm:20480000kB, anon-rss:10240000kB, file-rss:5000kB, shmem-rss:0kB
If a “page allocation failure” message appears, it means that the system was unable to allocate contiguous pages. This indicates that memory fragmentation may be progressing. Please refer to /proc/buddyinfo to check the fragmentation status.
kernel: page allocation failure: order:10, mode:0x20
kernel: Node 0 DMA32: 1234kB unavailable
kernel: Mem-Info:
kernel: active_anon:12345 inactive_anon:6789 active_file:123456 inactive_file:789012
If messages related to SLAB memory allocation appear, you should suspect a possible memory leak in the kernel.
kernel: SLUB: Unable to allocate 4096 bytes
kernel: kmalloc-64: active objects exceed threshold
kernel: Out of memory: kmalloc-1024 allocation failure
Web Server Logs
Check the web server logs to determine whether the request volume or the number of errors has increased significantly.
Note: The log output directory varies depending on the system design, so please adjust the paths according to your own environment.
- Access Log
Check /var/log/httpd/access_log (Apache) and /var/log/nginx/access.log (Nginx). - The following situations may be causing an increase in memory usage.
- A large number of POST requests
- A surge in file upload processing
- Returning responses with abnormally large response sizes
- Error Log
Check /var/log/httpd/error_log (Apache) and /var/log/nginx/error.log (Nginx). For example, you may be able to confirm cases where worker processes failed to start due to insufficient memory or terminated unexpectedly.
AP Server Logs
In some cases, information output in the application server logs can help identify the cause of increased CPU usage. Here, let’s take Tomcat as an example.
- catalina.out
This log contains Tomcat’s standard output and standard error. If OutOfMemoryError or exceptions are recorded, they may be contributing to increased memory usage, so you should proceed with further analysis. - gc.log
If heap memory usage is increasing, check whether GC (Garbage Collection) is occurring more frequently than usual.
Note: Enabling gc.log in Tomcat
In Tomcat, GC-related logs are not enabled by default. It is recommended to add the appropriate configuration so that gc.log is generated.
[root@quiz ~]# vi /opt/tomcat/bin/setenv.sh
[root@quiz ~]# cat /opt/tomcat/bin/setenv.sh
~~Omitted~~
## GC Log Setting
-Xlog:gc*,safepoint:file=$CATALINA_BASE/logs/gc.log:time,level,tags:filecount=5,filesize=10M"
[root@quiz ~]#
[root@quiz ~]# systemctl restart tomcat
[root@quiz ~]#
If GC-related logs are being output as shown below, the configuration has been successfully applied. In the example below, you can confirm that Minor GC is occurring within a normal range.
[2025-11-03T21:57:11.276+0900][info][safepoint   ] Safepoint "ICBufferFull", Time since last: 894905347 ns, Reaching safepoint: 7277 ns, Cleanup: 159379 ns, At safepoint: 3260 ns, Total: 169916 ns
[2025-11-03T21:57:11.352+0900][info][gc,start    ] GC(0) Pause Young (Normal) (G1 Evacuation Pause)
[2025-11-03T21:57:11.353+0900][info][gc,task     ] GC(0) Using 2 workers of 4 for evacuation
[2025-11-03T21:57:11.389+0900][info][gc,phases   ] GC(0)   Pre Evacuate Collection Set: 0.3ms
[2025-11-03T21:57:11.389+0900][info][gc,phases   ] GC(0)   Merge Heap Roots: 0.2ms
[2025-11-03T21:57:11.389+0900][info][gc,phases   ] GC(0)   Evacuate Collection Set: 31.4ms
[2025-11-03T21:57:11.389+0900][info][gc,phases   ] GC(0)   Post Evacuate Collection Set: 2.0ms
[2025-11-03T21:57:11.389+0900][info][gc,phases   ] GC(0)   Other: 0.7ms
[2025-11-03T21:57:11.389+0900][info][gc,heap     ] GC(0) Eden regions: 13->0(14)
[2025-11-03T21:57:11.389+0900][info][gc,heap     ] GC(0) Survivor regions: 0->2(2)
[2025-11-03T21:57:11.389+0900][info][gc,heap     ] GC(0) Old regions: 2->4
[2025-11-03T21:57:11.389+0900][info][gc,heap     ] GC(0) Humongous regions: 0->0
[2025-11-03T21:57:11.389+0900][info][gc,metaspace] GC(0) Metaspace: 6598K(6848K)->6598K(6848K) NonClass: 5909K(6016K)->5909K(6016K) Class: 689K(832K)->689K(832K)
[2025-11-03T21:57:11.389+0900][info][gc          ] GC(0) Pause Young (Normal) (G1 Evacuation Pause) 14M->4M(60M) 37.236ms
[2025-11-03T21:57:11.389+0900][info][gc,cpu      ] GC(0) User=0.03s Sys=0.04s Real=0.04s
DB Server Logs
In some cases, information recorded in the database server logs can help identify the cause of increased memory usage.
Here, as an example, we will explain how to check PostgreSQL logs.
- postgresql*.log
This log file records various operations and errors that occur within the PostgreSQL database. If memory usage is increasing, check whether any related events are recorded in this log. Logs such as the following may indicate the cause of increased memory usage:- ERROR: out of memory DETAIL: Failed on request of size 16777216.
This indicates that memory allocation failed due to insufficient memory. For example, you should suspect whether there is a leak related to work_mem (memory used for sorting and hash operations). - LOG: temporary file: path “base/pgsql_tmp/pgsql_tmp1234”, size 204800kB
This indicates that a temporary file was created because work_mem exceeded its limit. There may be a surge in sorting or hash operations.
- ERROR: out of memory DETAIL: Failed on request of size 16777216.
Memory Dump Analysis
If the cause cannot be identified through resource analysis or log analysis, analyzing a memory dump can be used as a last resort.
However, collecting a memory dump will stop the OS, so it cannot be intentionally obtained while the system is running in a production environment. It is recommended to configure automatic dump collection in advance, so that a dump is captured in the event of an OS crash.
The method for analyzing memory dumps is summarized in the article below, so please refer to it for details.
Beginner’s Guide to Linux Kernel Memory Dump Analysis: Practical kdump and crash Tutorial
Temporary Workaround for Increased Memory Usage
If high memory usage continues, it can affect overall system performance and, in some cases, may even cause critical processes to go down. Therefore, you should consider implementing temporary workarounds as early as possible.
Although the appropriate actions depend on the root cause, this section introduces examples of temporary workarounds focused primarily on the OS layer.
As shown below, let’s walk through a workaround example using a scenario where a bash process is consuming a large amount of memory.
For reference, after running the top command, you can press “M” to sort the processes by memory usage in descending order.
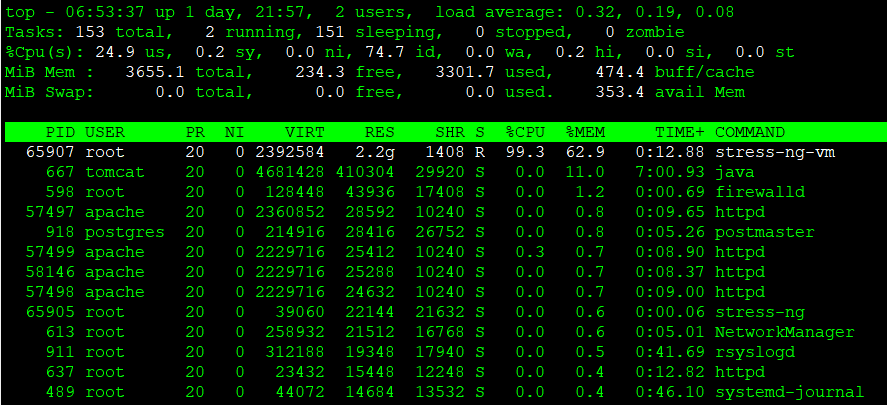
In this example, memory usage is intentionally increased using stress-ng (a load testing tool).
stress-ng --vm 1 --vm-bytes 90% --vm-keepProcess stop
If you have identified the process responsible for the increase in memory usage, stopping that process can be an effective workaround.
However, before taking action, make sure to carefully verify that stopping the process will not impact service availability or business operations.
kill command
Let’s try stopping the process using the kill command. Specify the PID as an argument when executing the kill command. As shown below, a message indicating that the process has been terminated will be displayed in the standard output.
[root@quiz ~]# kill 65907
[root@quiz ~]#
In some cases, a process may hang and cannot be terminated using the default kill command (which sends -15, or SIGTERM).
In such situations, you can forcefully terminate the process by specifying the -9 option (which sends SIGKILL) with the kill command.
[root@quiz ~]# kill -9 65907
[root@quiz ~]#
systemctl stop command
Although it does not apply to this particular example, if you have identified the problematic service and it is safe to stop it, you should use the systemctl stop command instead of the kill command to terminate it properly.
Configuring Resource Limits
If you have identified a process whose memory usage is increasing but cannot stop it permanently, setting an upper limit on its memory usage can be an effective fail-safe measure.
In Linux, you can set memory usage limits for specific processes using cgroups (for example, the MemoryMax directive in systemd) or ulimit.
However, once the configured limit is reached, memory allocation may fail, or the process may be forcibly terminated by the OOM Killer.
Therefore, this configuration should be used as a safety mechanism to minimize the impact on other processes or the entire system in the event of runaway memory usage.
It is important to note that it does not serve as a permanent solution to the root cause of increasing memory consumption.
Memory Capacity Expansion
While it may be difficult to address on physical servers, expanding memory capacity is relatively straightforward in virtual server environments.
If it is clear that physical memory is consistently insufficient, increasing the memory allocation can be an effective solution.
However, if the root cause is a memory leak or abnormal cache growth, simply increasing memory capacity may only delay the recurrence of the issue.
Therefore, it is important to identify the underlying cause first and consider memory expansion as a last resort.
Permanent Countermeasures for High Memory Usage
Permanent countermeasures refer to actions taken to eliminate the root cause of rising memory usage.
Below are some typical examples.
- Application Fixes
Resolve issues such as memory leaks or unnecessary object retention, and release an updated version of the application as needed—potentially including library upgrades. - Process and Workload Design Improvements
Review concurrency-related design aspects—such as the number of workers in a web server or the number of threads in an application server—and adjust middleware configurations accordingly. - Memory Design Review
If you are using Java, review the JVM memory configuration—such as heap size and GC settings—and adjust them according to the application’s memory usage characteristics. - Batch Processing Design Improvements
Avoid loading large volumes of data all at once. Instead, improve the design by splitting processing tasks or adjusting execution timing to prevent memory load from concentrating at a single point in time.
Summary
An increase in memory usage on a Linux server can lead to performance degradation or service outages if left unaddressed. Therefore, prompt and systematic action is essential.
Below is a summary of the key points explained in this article.
Understand the Overall Situation First
- Check available memory using free and /proc/meminfo
- Use vmstat to verify whether swap-in/swap-out activity is occurring
Identify What Is Consuming Memory
- Use top and ps to list processes with high memory usage
- Use smem and pmap to check actual memory consumption and its breakdown (heap / shared memory)
- Use slabtop to detect abnormal increases in kernel memory usage
Corroborate the Cause Through Logs
- Check OS logs for OOM Killer events or memory allocation failures
- Review Web / Application / DB server logs to identify increased load or abnormal behavior
Temporary Workarounds to Minimize Impact
- Stop or restart the problematic process
- Limit memory usage using cgroups or ulimit
- Add more memory if necessary
Permanent Fixes to Prevent Recurrence
- Fix application memory leaks
- Review system design, including the number of processes and threads
- Improve memory configuration for JVMs and batch processing systems
When responding to memory-related issues, the most practical approach in production systems is to follow this flow:
“Understand the current state through metrics → Narrow down the cause using processes and logs → Mitigate impact with temporary measures → Prevent recurrence with permanent countermeasures.”

コメント